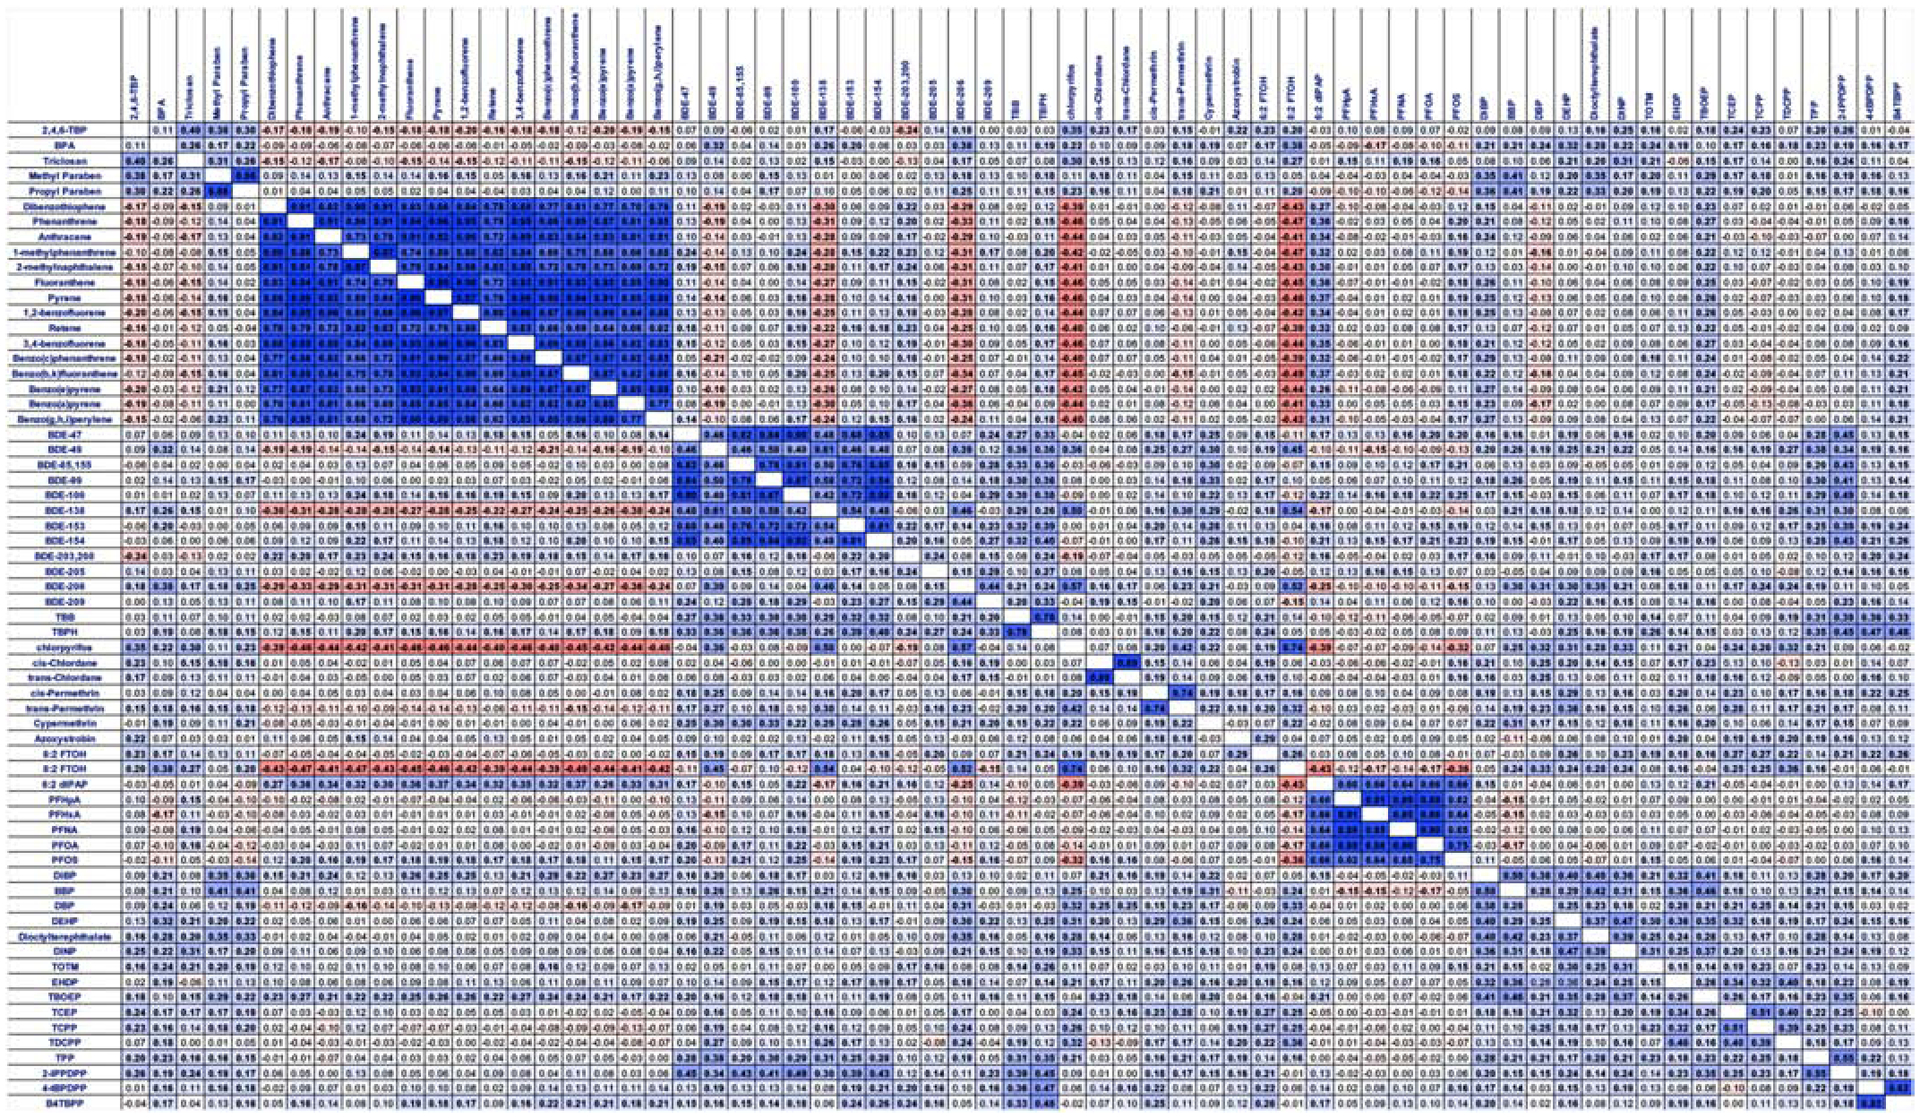
Figure 3: Correlations Among Targeted Chemical Concentrations in Household Dust.

Spearman’s correlations between concentrations of targeted semi-volatile contaminant concentrations (only performed for chemicals with ≥ 75% detection rate across extracts) in house dust extracts. Correlations performed using SAS 9.4; bolded samples represent significant (p<0.05) correlations, and the color depicts the strength and direction of the correlation. Darker colors represent a stronger correlation, blue coloration depicts positive correlations, and red depicts negative correlations.
