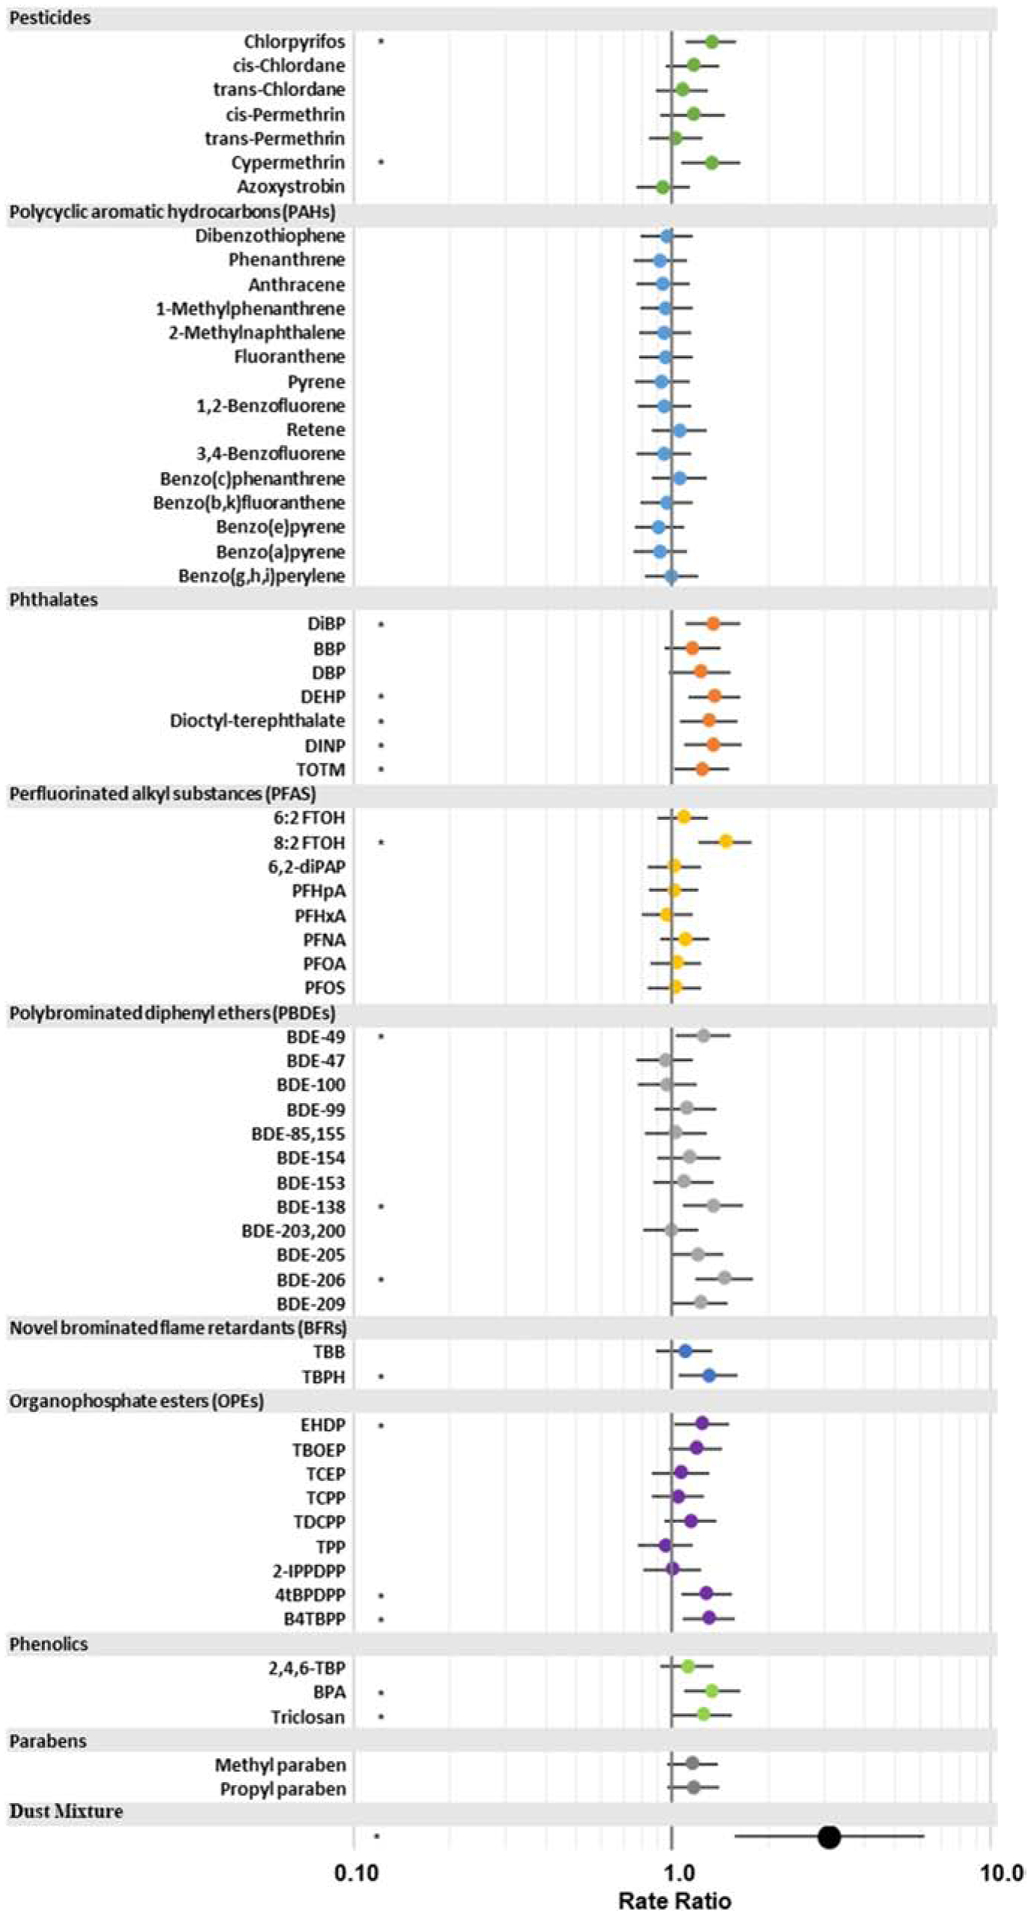
Figure 5: House dust mixtures and triglyceride accumulation.

Quantile g-computation was performed with all frequently detected contaminants in dust and triglyceride accumulation. Analyses were first performed for each contaminant individually and then for all contaminants in mixture. Rate ratios estimates (and 95% confidence intervals) represent the expected change in percent triglyceride accumulation for a one quartile increase in all exposures. For example, one quartile in the contaminant mixtures corresponds to a 212 percent increase in the percent triglyceride accumulation of dust samples (RR=3.12; 95% CI: 1.58, 6.17; p<0.001). Different colors represent classes of contaminants and * denotes statistical significance at p<0.05.
