Figure 5.

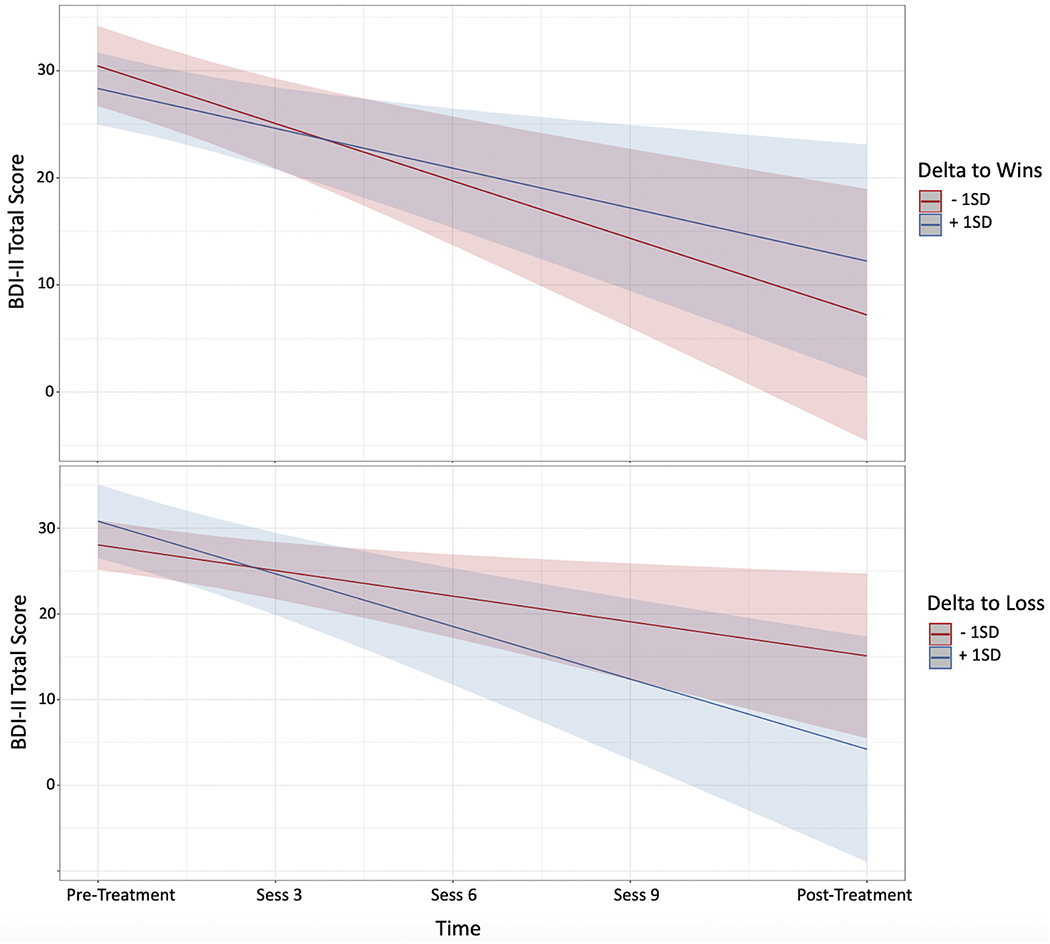
Plot of pre-treatment delta power by time interactions from the model. Delta to wins by time interaction is shown in the top panel, and delta to losses by time interaction in the bottom panel.

Plot of pre-treatment delta power by time interactions from the model. Delta to wins by time interaction is shown in the top panel, and delta to losses by time interaction in the bottom panel.