Figure 6.

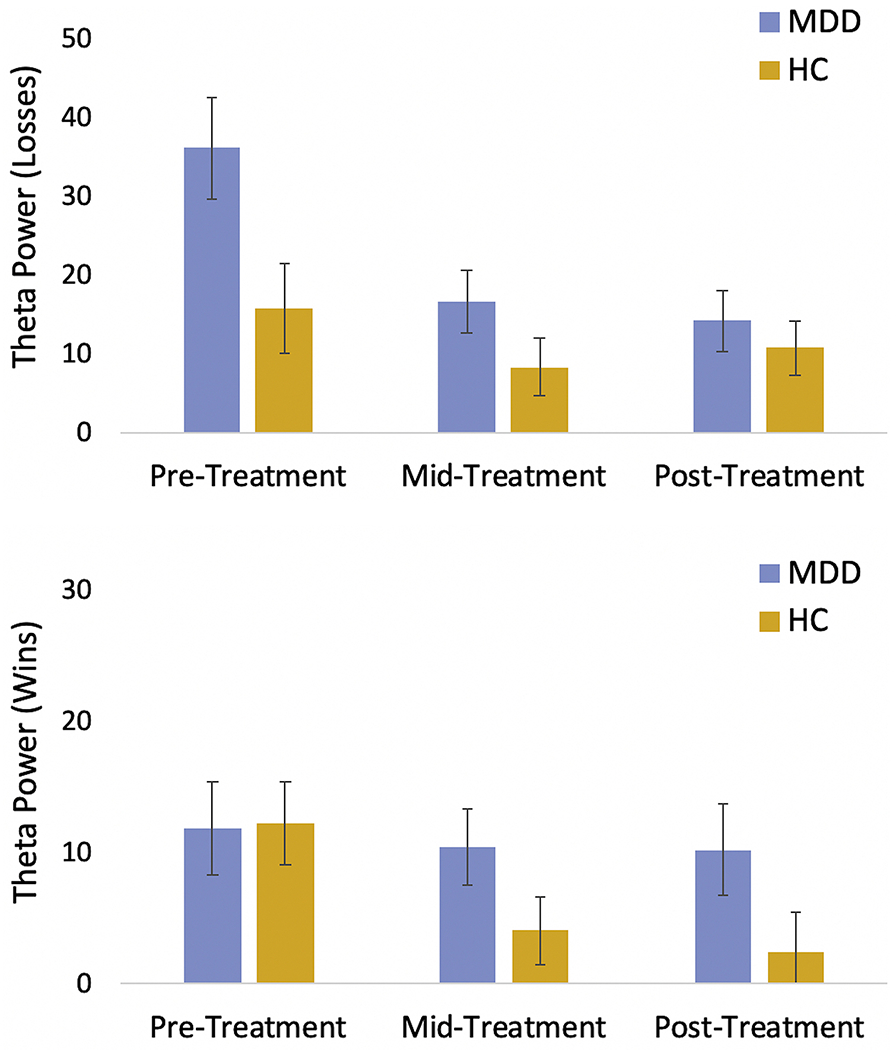
Change in theta power to losses (top panel) and wins (bottom panel) in the MDD participants (blue) vs. HC participants (gold) over time (model-derived estimated marginal means). Error bars represent standard error

Change in theta power to losses (top panel) and wins (bottom panel) in the MDD participants (blue) vs. HC participants (gold) over time (model-derived estimated marginal means). Error bars represent standard error