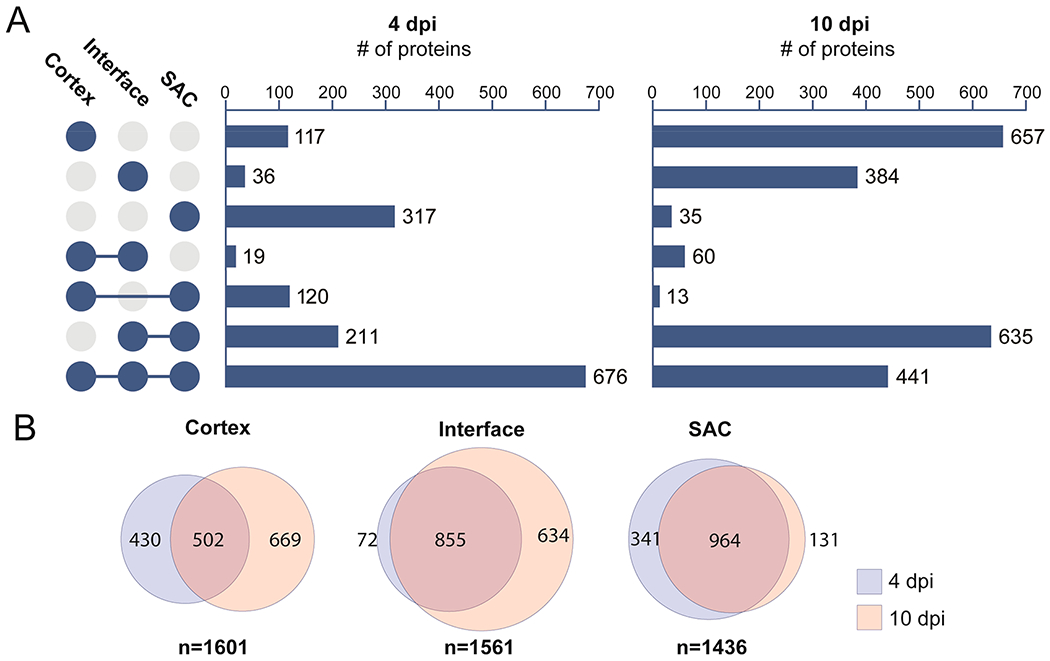
Figure 3.

Comparison of the proteome from the different regions in and around staphylococcal tissue abscesses. Data are combined host and bacterial proteins. (A) UpSet plot displaying unique and shared proteins identified from the three sampled locations. (B) Comparison of the proteome from individual regions over the course of infections (4 vs 10 dpi).
