Figure 5.

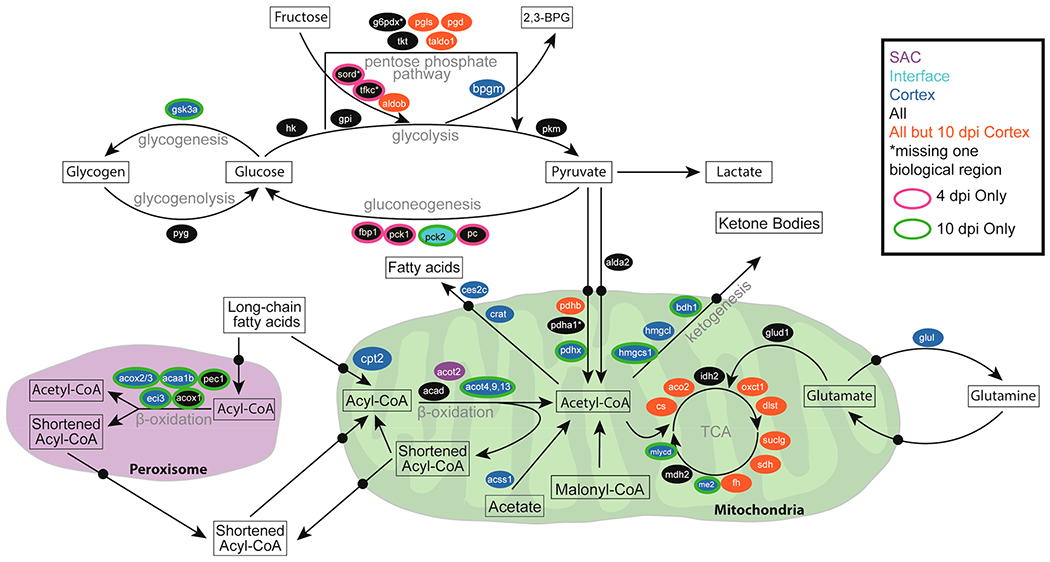
Overview of spatiotemporal distribution of proteins involved in central metabolism. Arrows denote metabolic pathways; ovals indicate genes, and colors indicate time point and region where proteins were detected.

Overview of spatiotemporal distribution of proteins involved in central metabolism. Arrows denote metabolic pathways; ovals indicate genes, and colors indicate time point and region where proteins were detected.