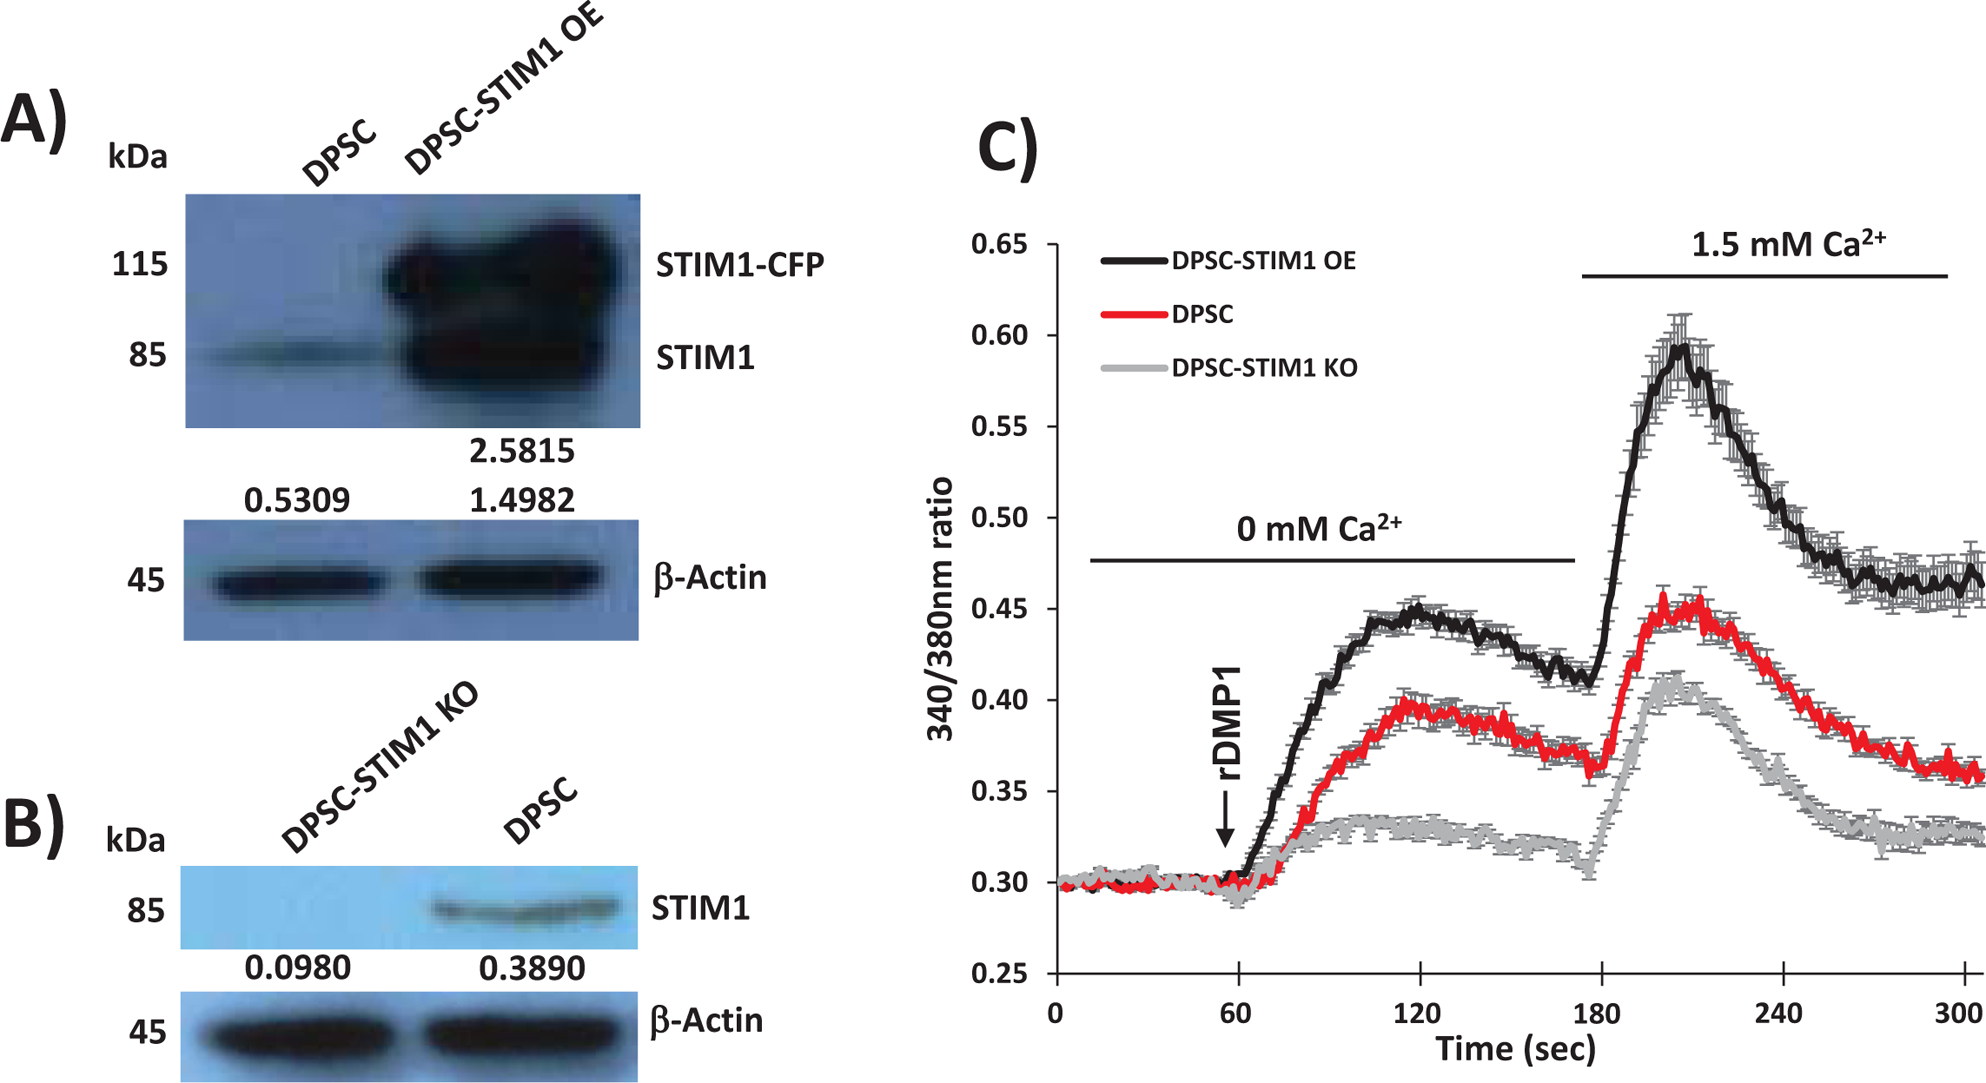
Fig 4. Generation of transgenic DPSC cell-lines and imaging of DMP1 induced SOCE:

(A) Western blotting to demonstrate the overexpression of STIM1 (DPSC-STIM1OE). The relative STIM1 densities to β-actin are shown. Note presence of exogenous CFP-STIM1.
(B) Western blotting to demonstrate the knockdown of STIM1 (DPSC-STIM1 KO). The relative STIM1 densities to β –actin are shown. Note lower expression level of endogenous STIM1.
(C) [Ca2+]i release was measured in Fura-2AM-loaded control DPSCs and the transgenic cell lines as described in “Materials and Methods”. Representative traces show the average changes in intracellular Ca2+ (F 340/380) recorded simultaneously in a number of individual cells. DMP1 was added (indicated by the arrow) in the absence of Ca2+ to deplete Ca2+ stores followed by addition of 1.5mM Ca2+ to trigger SOCE to replenish the intracellular Ca2+. Note higher calcium release and influx in DPSC-STIM1OE cells when compared with DPSC-STIM1KO and control DPSC cells.
