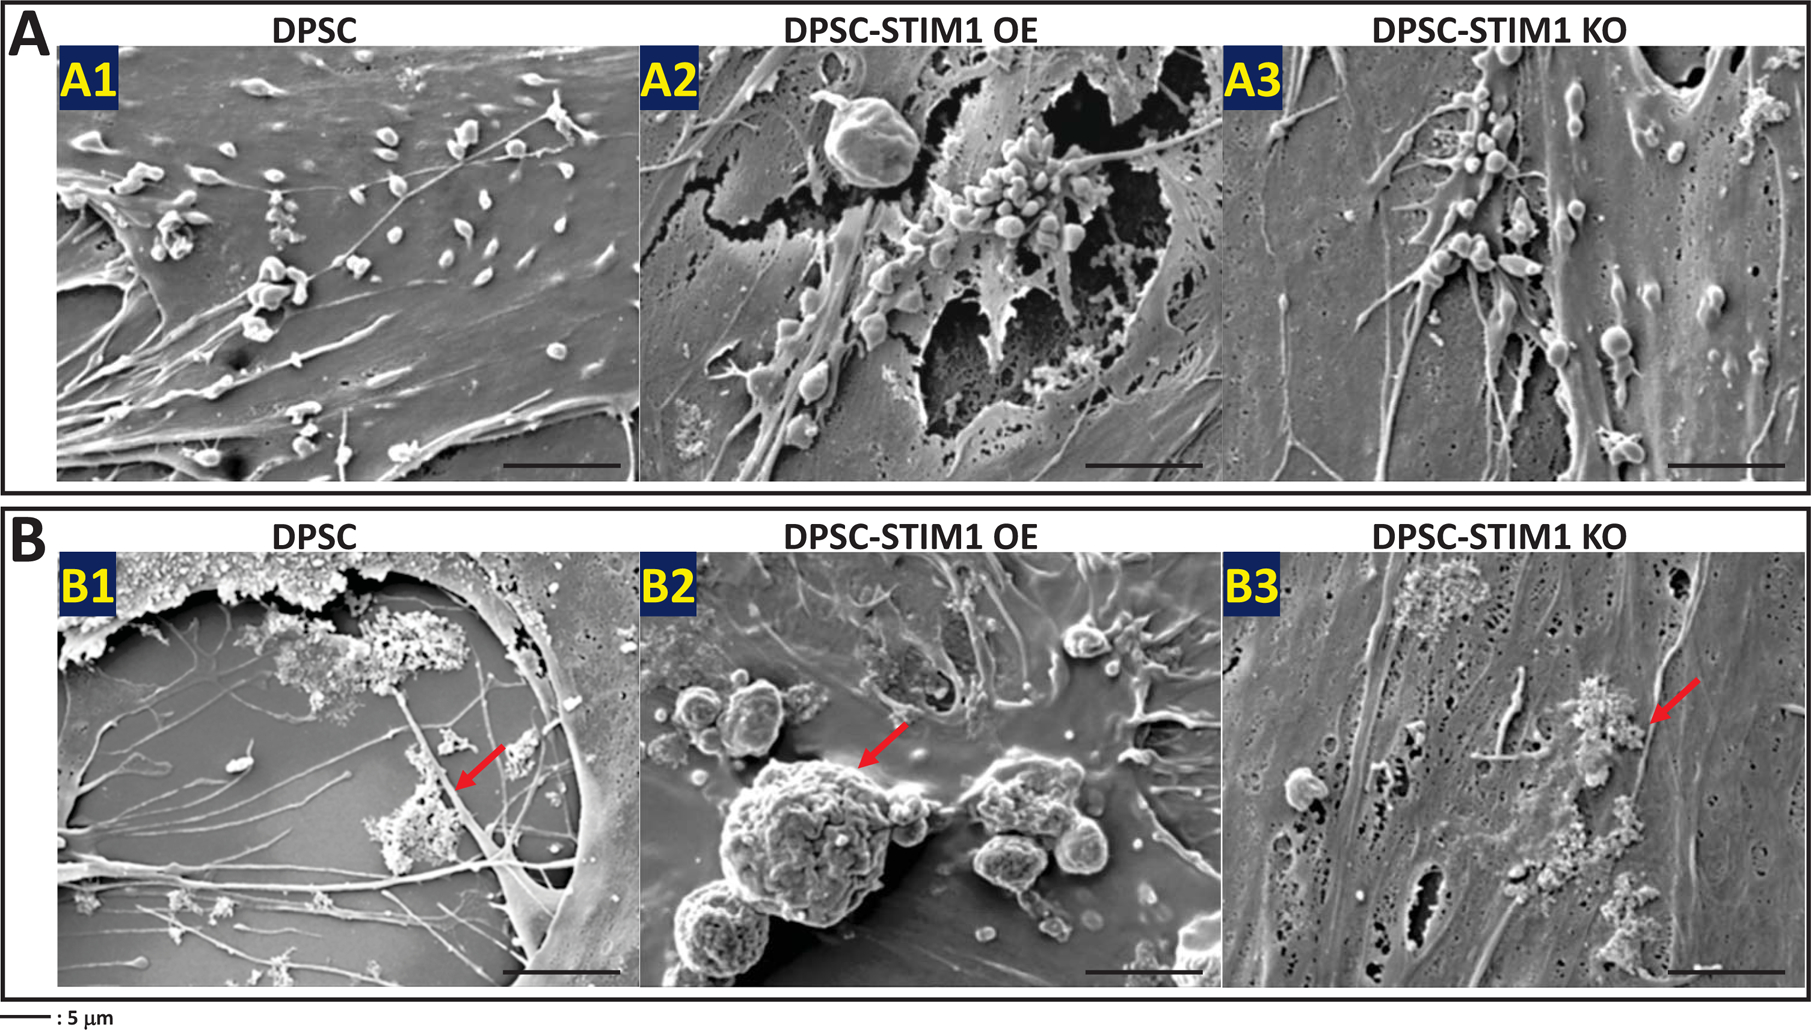
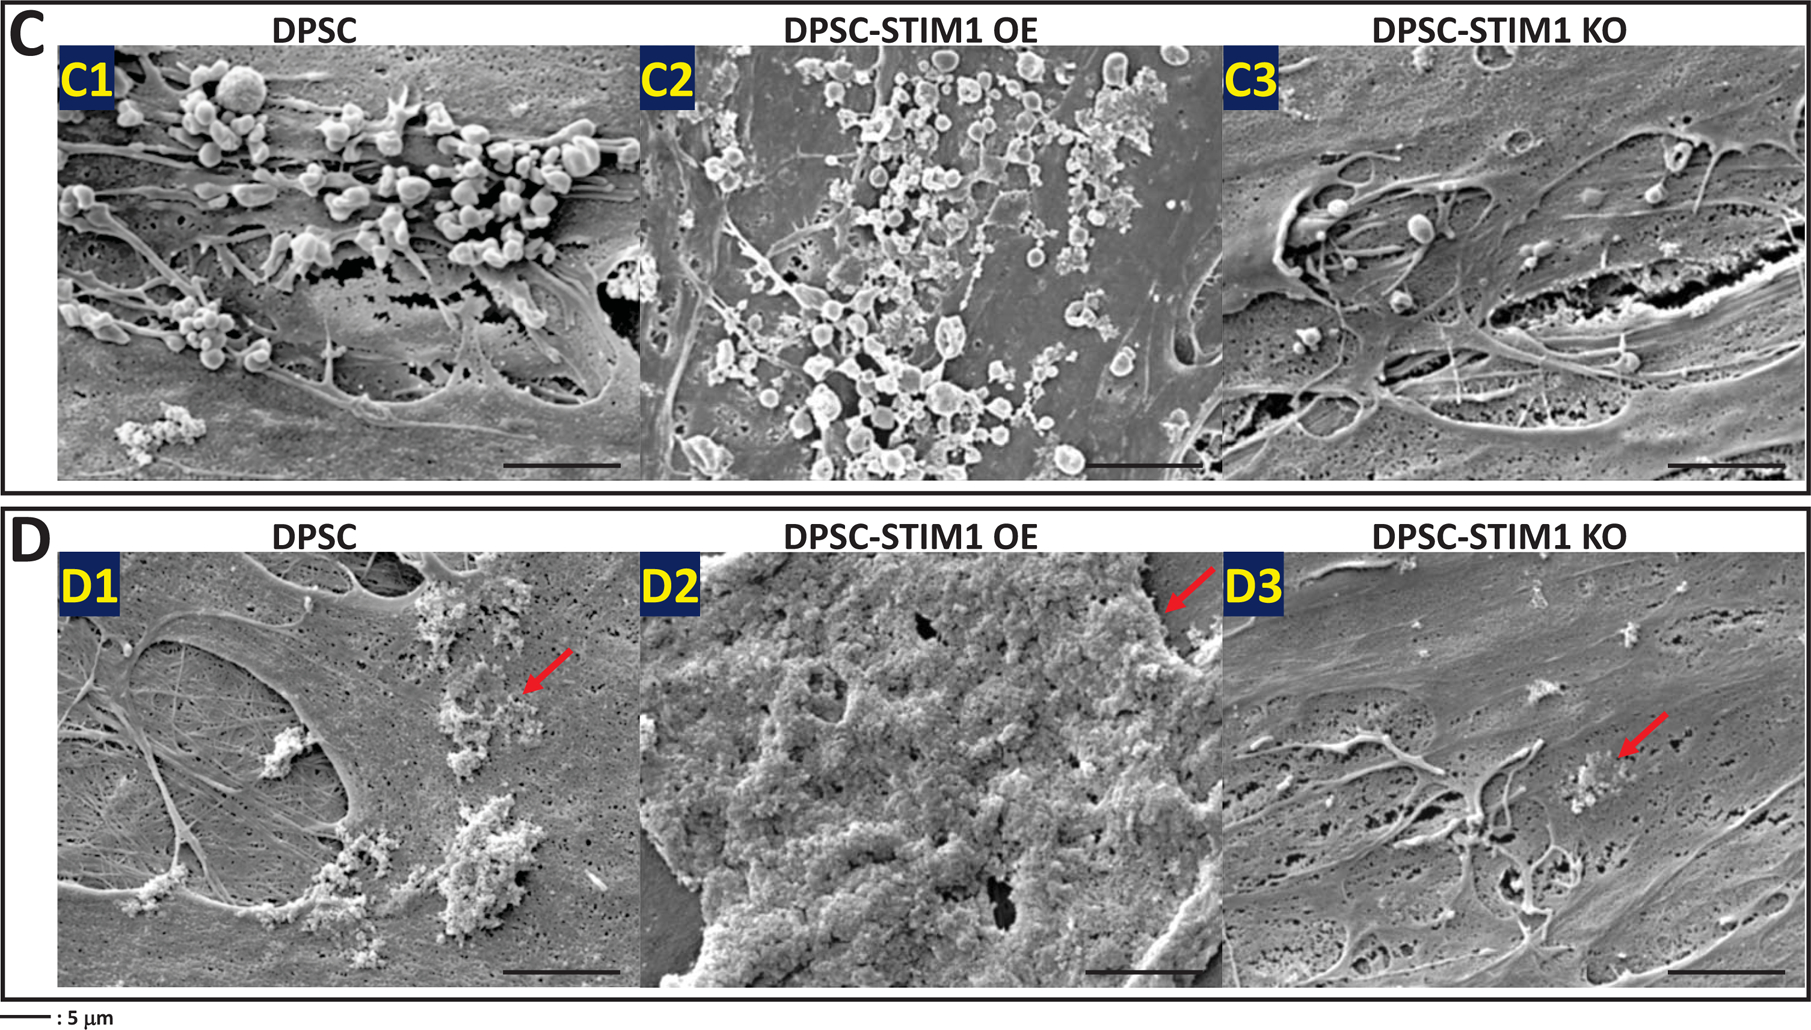
Fig 6. Electron Microscopy images of the secreted ECM by DPSC, DPSC-STIM1OE and DPSC-STIM1KO cells.


(A) Representative FESEM images showing the presence of vesicles in the ECM secreted by the 3 cell types (A1–A3) when cultured under growth media conditions for 14 days.
(B) Representative FESEM images showing mineral deposition by the 3 cell types (B1–B3) cultured under growth conditions for 14 days.
(C) Representative FESEM images showing the presence of vesicles in the ECM deposited by 3 cell types (C1–C3) when cultured for 14 days under differentiation conditions.
(D) Representative FESEM images showing the deposition of mineral in the ECM of the 3 cell types (D1–D3) when cultured for 14 days under differentiation conditions.
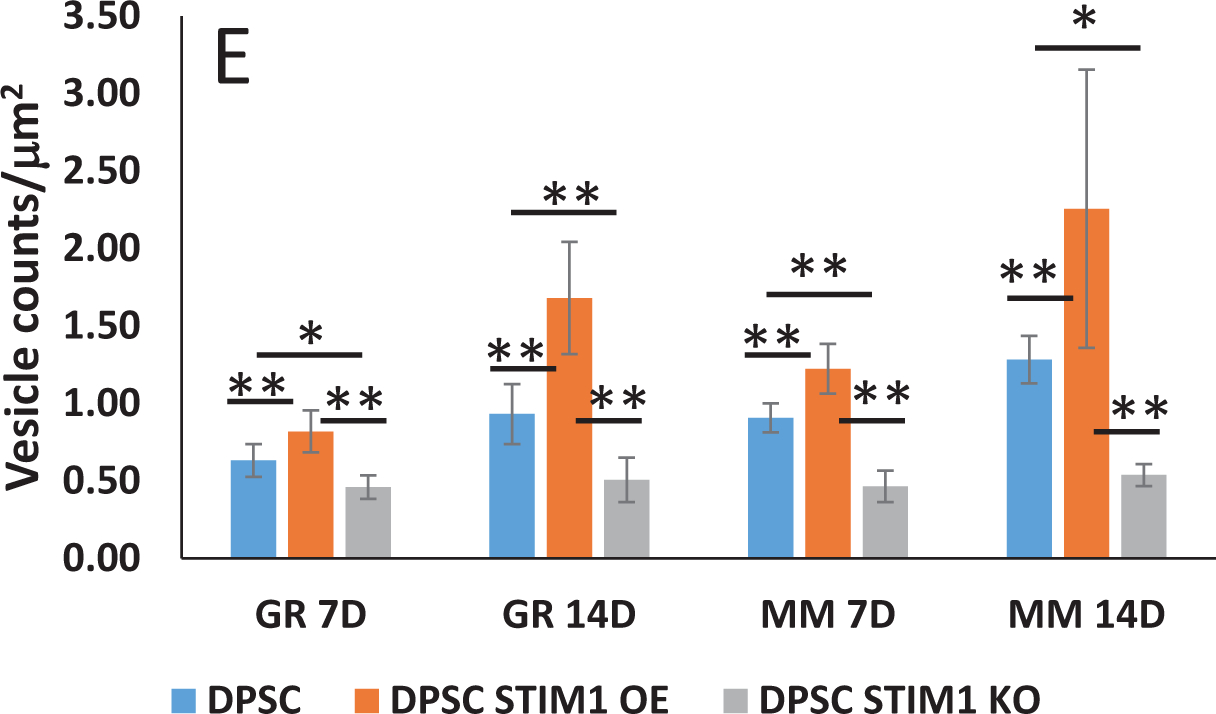
(E) Number of vesicles secreted by the 3 cell types under different culture conditions. Statistical significance as indicated. **p<0.01; *p<0.05.
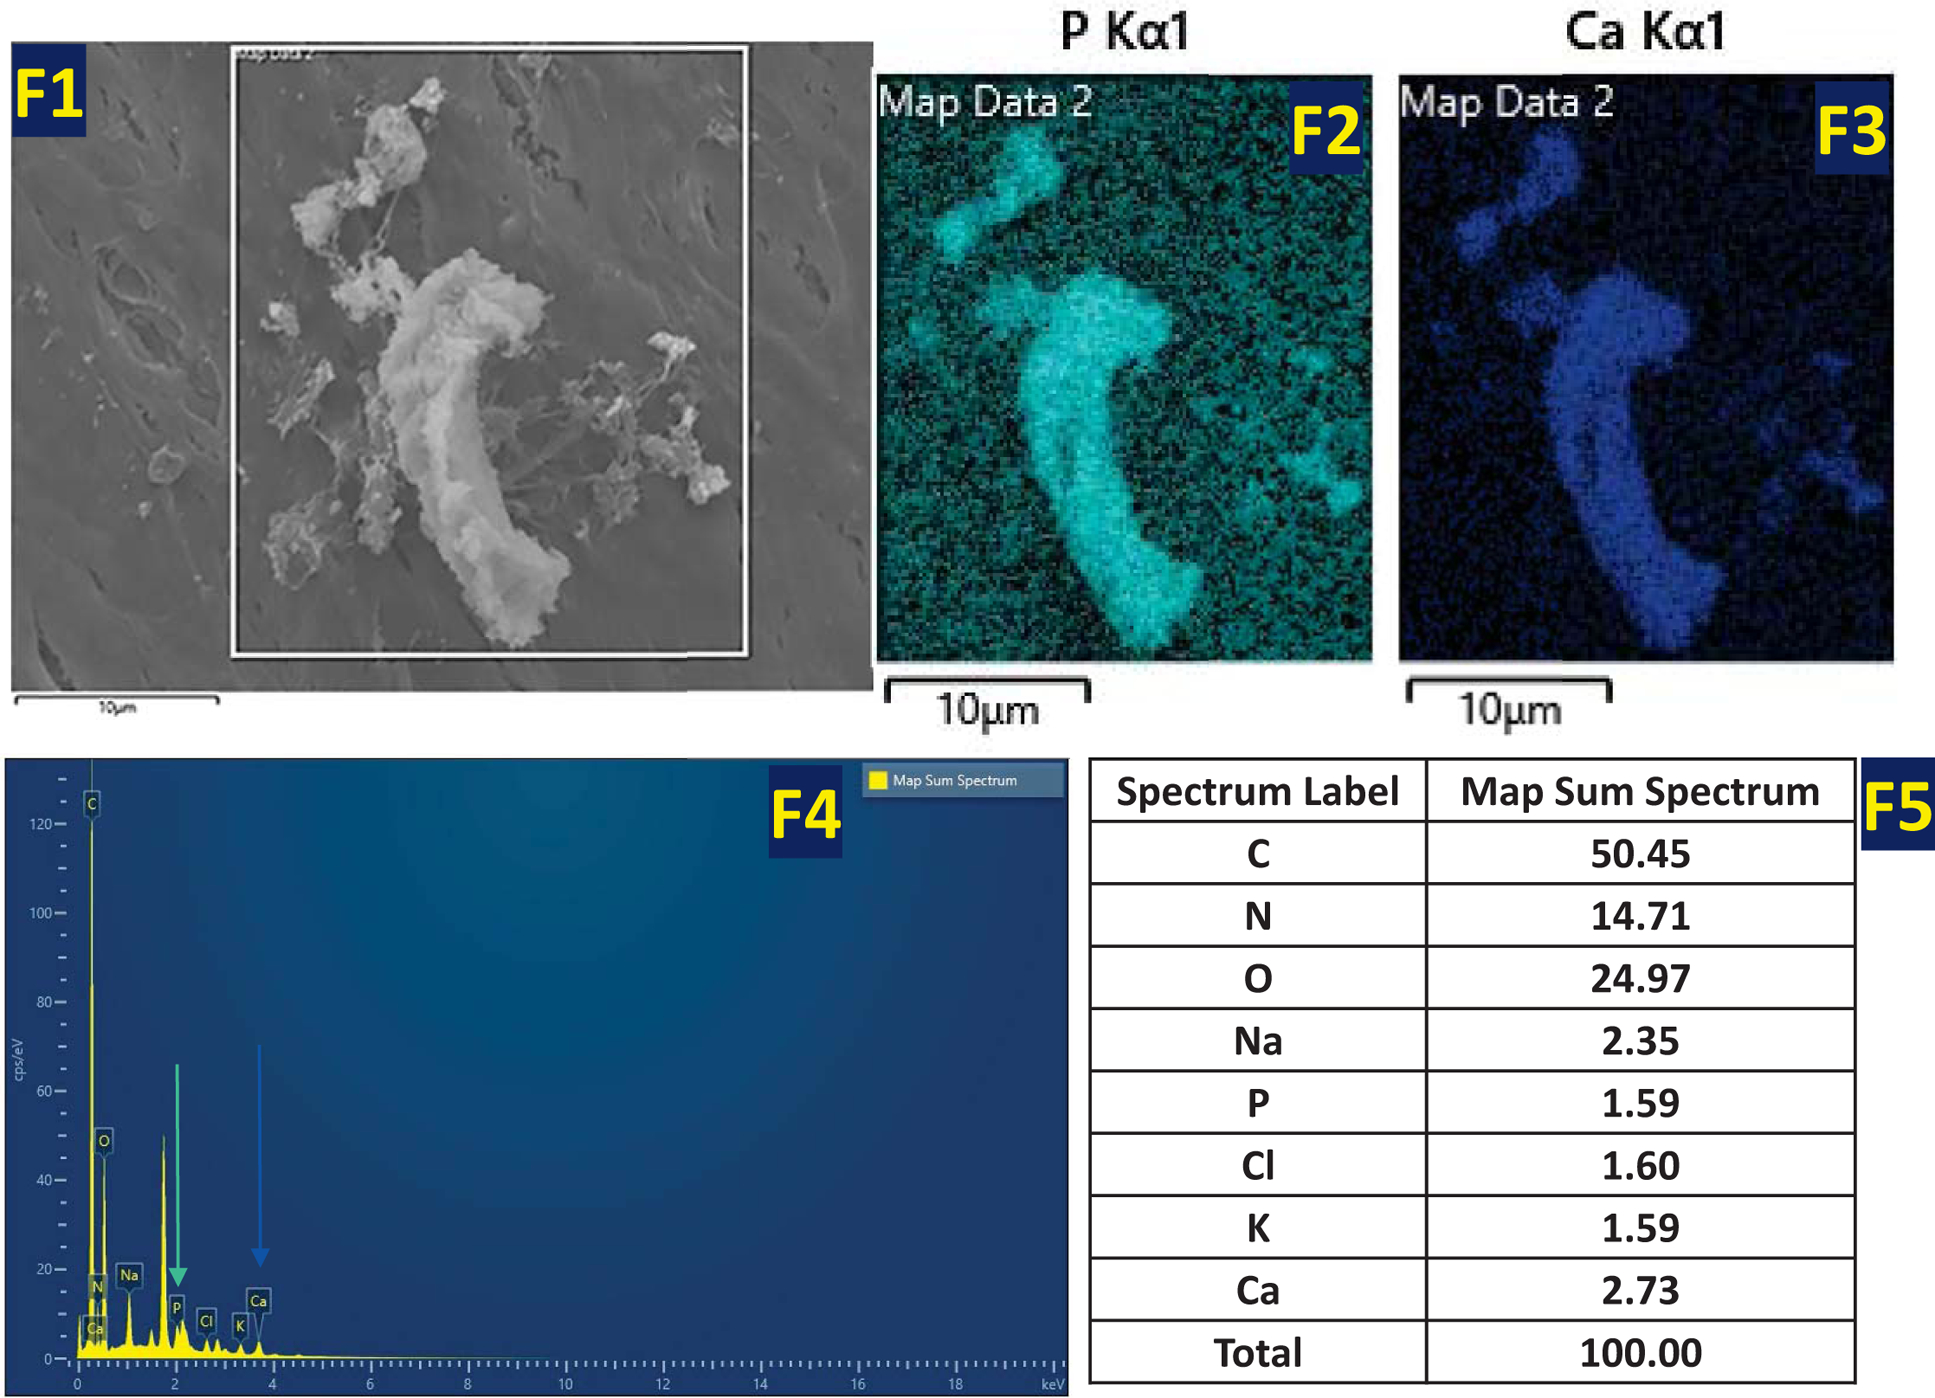
(F) Spatial distribution of Pi (Cyan map) and Ca 2+ (Blue map) as obtained by EDX analysis of the mineral deposited by DPSC-STIM1OE cells (F1–F3). Element spectrum and composition (F4 & F5).
