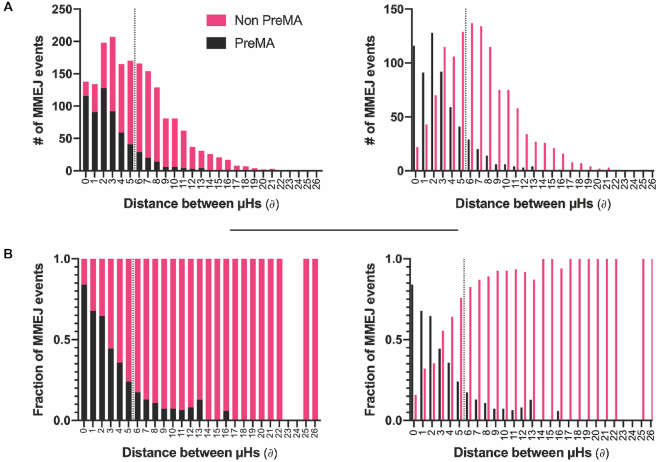
Figure 4.
PreMA distribution of MMEJ events as a function of the distance between the microhomologies employed for repair. (A) Stacked (left) and staggered (right) distributions of the number of MMEJ repair events in a large gene editing data set (20) and their PreMA status were plotted as a function of the distance between the microhomologies (μHs) used for repair (∂). The amount of MMEJ events increases after a ∂ of 1 bp and then decreases consistently as a function of ∂ after 5 bp. (B) The fraction of PreMAs across each ∂ bin in A is plotted as a function of ∂. The PreMA fraction decreases in an exponential-like fashion as a function of ∂. The dotted lines in both A and B represent the classification threshold employed by MENTHU for PreMA predictions. Everything to the left of the dotted line is predicted as PreMA as long as the corresponding MENTHU score is ≥1.50.

