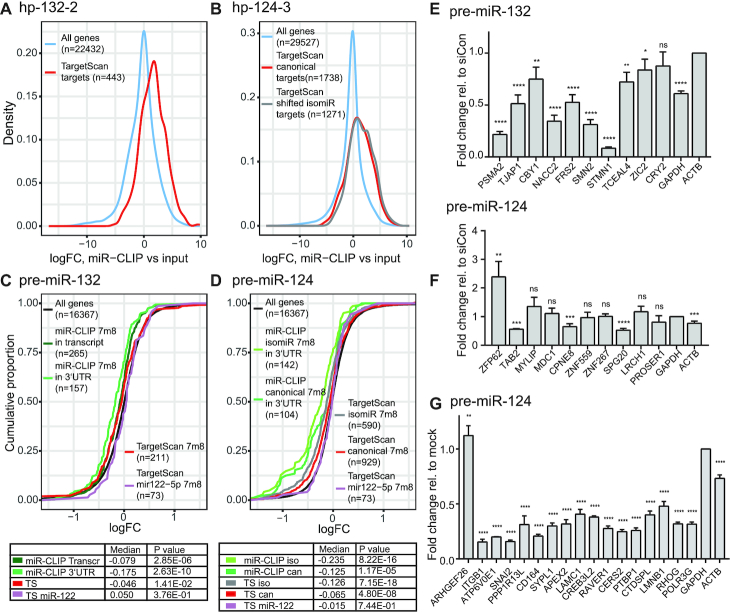
Figure 3.
MiR-CLIP-targetomes of miR-124-3p and miR-132-3p. (A and B) Density plots of log2 fold changes of TargetScan-predicted targets in the hp-132-2 (A) and hp-124-3 (B) miR-CLIP samples, compared to the respective input samples (hp-132-2: P = 2.27e-61; hp-124-3: P = 8.47e-174 (miR-124), P = 9.58e-192 (iso-miR-124); Wilcoxon rank-sum test comparing gene subset to genes outside subset). (C andD) Cumulative distributions of log2 fold changes (logFC) in mRNA abundances after 40 nM transfections of pre-miR-132 (C) and pre-miR-124 (D) in HEK293T cells. The distribution of fold changes in different subsets of genes are plotted for miR-132- and miR-124-TargetScan-predicted targets with 7m8 sites in the top 1000 miR-CLIP (at least one 7m8 target motif in the 3′UTR or within the whole transcript); TargetScan-predicted miR-122-5p 7m8 seed targets were used as negative controls. P values obtained by Wilcoxon rank-sum test were obtained by comparing gene subsets to genes outside the subset. (E) Levels of transcripts in the top ten hp-132-2-captured targets assayed with qPCR after 40 nM pre-miR-132 transfection. (F) Levels of transcripts in the top ten hp-124-3-captured targets validated by qPCR after 40 nM pre-miR-124 transfection. (G) Transcript levels of 17 miR-124 strongly destabilized targets after transfecting 40 nM pre-miR-124 to the cells (cut-off at logFC <-0.8 (FC <0.57)). Significance compared to mock treatment. For (E, F) N = 4, (G) N = 3, error bars represent standard deviations. Asterisks denote statistical significance compared to siCon or mock respectively (Student’s t test): ns = P ≥ 0.05 * = P < 0.05, ** = P ≤ 0.01, *** = P ≤ 0.001, **** = P ≤ 0.0001.

