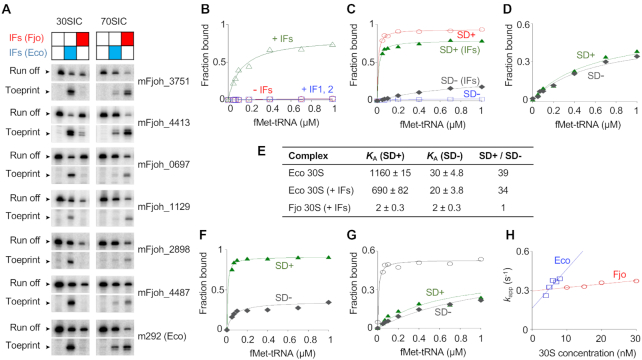
Figure 1.
Biochemical evidence that E. coli and F. johnsoniae ribosomes differ in ASD function. (A) F. johnsoniae 30S and 70S complexes formed on various mRNAs in the presence of initiation factors (IFs) from F. johnsoniae (Fjo) or E. coli (Eco) as indicated. The toeprint band indicates the cognate complex (with start codon in P site), and the run-off band reflects unbound mRNA. Messages mFjoh_xxxx are named based on corresponding F. johnsoniae genes; m292 is a model E. coli mRNA (58). (B–D) Experiments to measure the overall equilibrium association constant (KA) for 30S IC formation. For each experiment, the amount of complex formed was quantified and plotted as a function of fMet-tRNA concentration. (B) F. johnsoniae 30S subunits (1 μM) were incubated with mFjoh_4413 and fMet-tRNA (various concentrations, as indicated), in the presence of all E. coli factors (+IFs, 1.5 μM each; open green triangles), IF1 and IF2 only (+IF1,2; open blue squares), or no factors (-IFs; open red circles). (C) E. coli 30S subunits (0.1 μM) were incubated with mRNA (m291, SD+ (58); or its derivative m295, SD-; as indicated) and fMet-tRNA (various concentrations, as indicated), in the absence or presence of E. coli factors (0.5 μM each), as indicated. Messages m291 and m295 are identical except that the latter has cytosines in place of guanines at positions –9 and –10. (D) F. johnsoniae 30S subunits (1 μM) were incubated with mRNA (m291, SD+; or m295, SD-; as indicated) and fMet-tRNA (various concentrations, as indicated), in presence of E. coli factors (1.5 μM each). (E) Summary of KA values (in units of μM−2) obtained from experiments like those of panels C-D. (F) 70S ribosomes (0.1 μM) from E. coli were incubated with mRNA (m291, SD+; or m295, SD-; as indicated) and fMet-tNA (various concentrations, as indicated) in presence of E. coli initiation factors (0.5 μM each). (G) 70S ribosomes (1 μM) from F. johnsoniae were incubated with mRNA (m291, SD+, filled green triangles; m295, SD-, filled gray diamonds; or mFjoh_4413, open black circles) and fMet-tRNA (various concentrations, as indicated) in the presence of F. johnsoniae initiation factors (1.5 μM each). (H) The rate of binding of a SD-containing RNA oligonucleotide to the 30S subunit was measured using a double-membrane filtration method (64). The apparent rate (kapp) was plotted versus 30S concentration (E. coli, open blue squares; F. johnsoniae, open red circles), to estimate kon (E. coli, 30 μM−1s−1; F. johnsoniae, 2.7 μM−1s−1) and koff (E. coli, 0.16 s−1; F. johnsoniae, 0.29 s−1).

