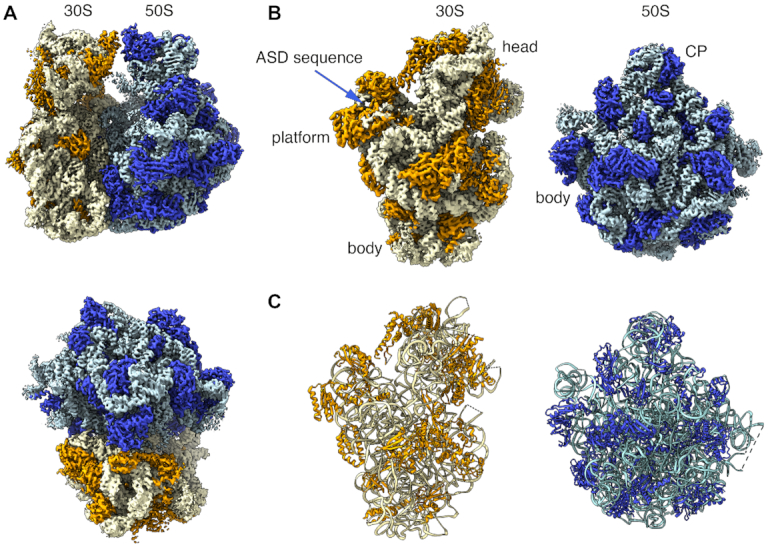
Figure 2.

Structure of the Flavobacterium johnsoniae ribosome. (A) Side and top views of the cryo-EM map of the F. johnsoniae ribosome at 2.8 A resolution. The rRNA and r proteins in the 30S subunit are shown in yellow and orange, respectively. In the 50S subunit, the rRNA is colored in pale blue (rRNA) and the r proteins in dark blue. (B) Solvent view of the 30S and 50S subunit forming the F. johnsoniae ribosome. The main landmarks of the 30S and 50S subunits and the ASD sequence in the small subunit are indicated. CP indicates the central protuberance. (C) Solvent view of the molecular models derived for the 30S and 50S subunits derived from the cryo-EM map of the F. johnsoniae ribosome. The rRNA and r proteins and panel B and C are colored following the same scheme as in panel A.
