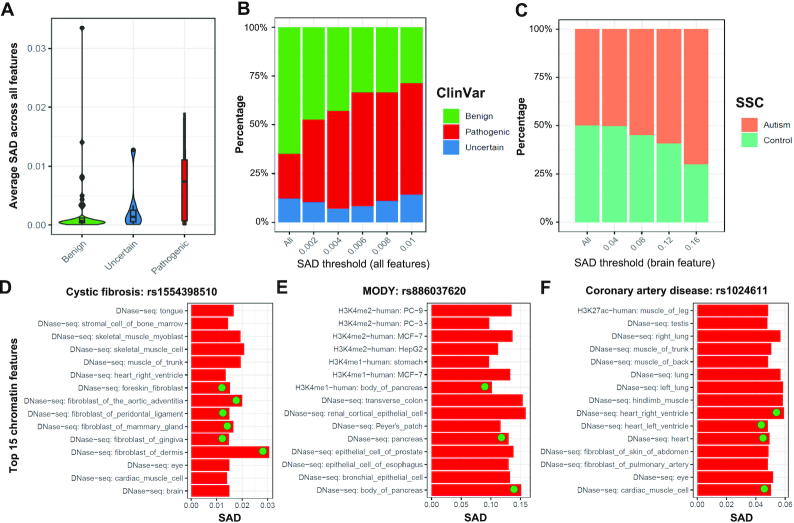
Figure 4.
GWAS causal SNPs validation. (A) Comparison of the average absolute SAD values among three sets of intergenic variants (benign, uncertain and pathogenic) as annotated in ClinVar database. (B) The proportion of ClinVar benign, uncertain and pathogenic variants by the SAD threshold, showing the improvement proportion of pathogenic variants along with SAD threshold improvement. (C) The proportion of de novo mutations in autism spectrum disorder (ASD) health and patient siblings comparison, by different SAD threshold. Of note, different from the ClinVar variants that were associated with various diseases or phenotypes, here, we only compared the average SAD scores of the non-coding variants over all brain tissues. (D–F) The top 15 chromatin features for three non-coding variants in ClinVar database with the highest SAD values were presented: (D) rs1554398510 associated with cystic fibrosis, (E) rs886037620 associated with maturity-onset diabetes of the young (MODY), and (F) rs1024611 associated with coronary artery disease. We labeled a circle on chromatin features consistent with their disease symptoms.

