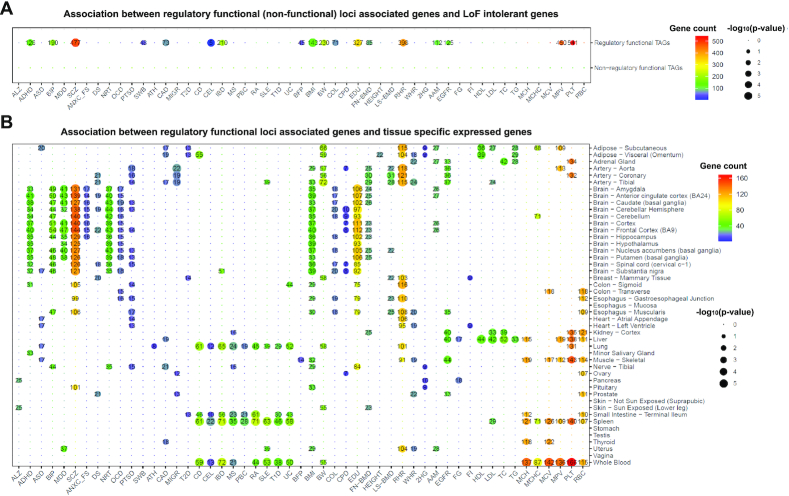
Figure 6.
Comparison between 51 traits regulatory and non-regulatory loci associated genes. (A) Fisher's exact test of the association between regulatory (non-regulatory) TAGs and LoF intolerant genes (ExAC pLI > 0.9) for each trait. (B) Tissue-specific enrichment analysis of 51 TAGs containing regulatory loci. The heatmap only shows the significant trait-tissue associations by P-value < 0.05, the shared gene count between trait regulatory loci associated genes and tissue-specific expressed genes were labeled on thie figure.

