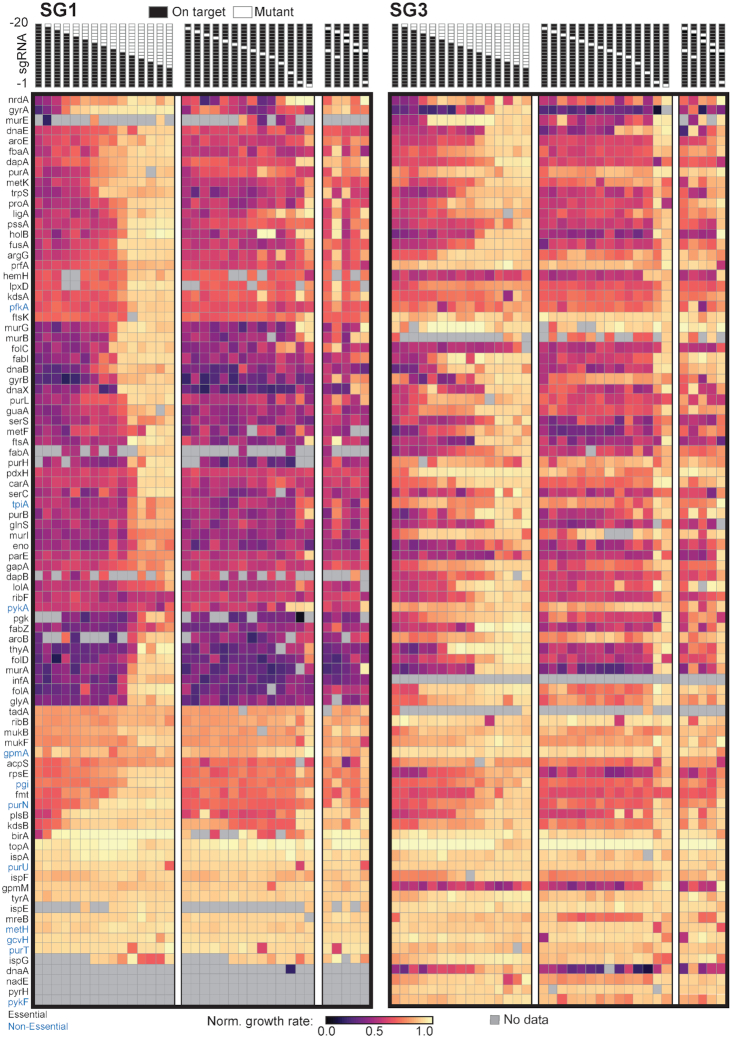
Figure 3.
Heatmap of normalized growth rates for all sgRNAs in this study. Data was renormalized so that wildtype-like growth is 1 and no growth is 0 (methods). sgRNA design strategies are indicated at the top of the figure. Each box indicates a nucleotide in the sgRNA homology region. White boxes indicate a mutation to the complement nucleotide. Black boxes indicate that position is not mutated. Gene names are listed on the y-axis. Black gene names are essential based on previous reporting from the Keio collection, blue are nonessential. Grey squares indicate no data was collected for that specific sgRNA either because it could not be designed, it was not correctly synthesized, or data did not pass quality filters (Supplementary Figure S3).

