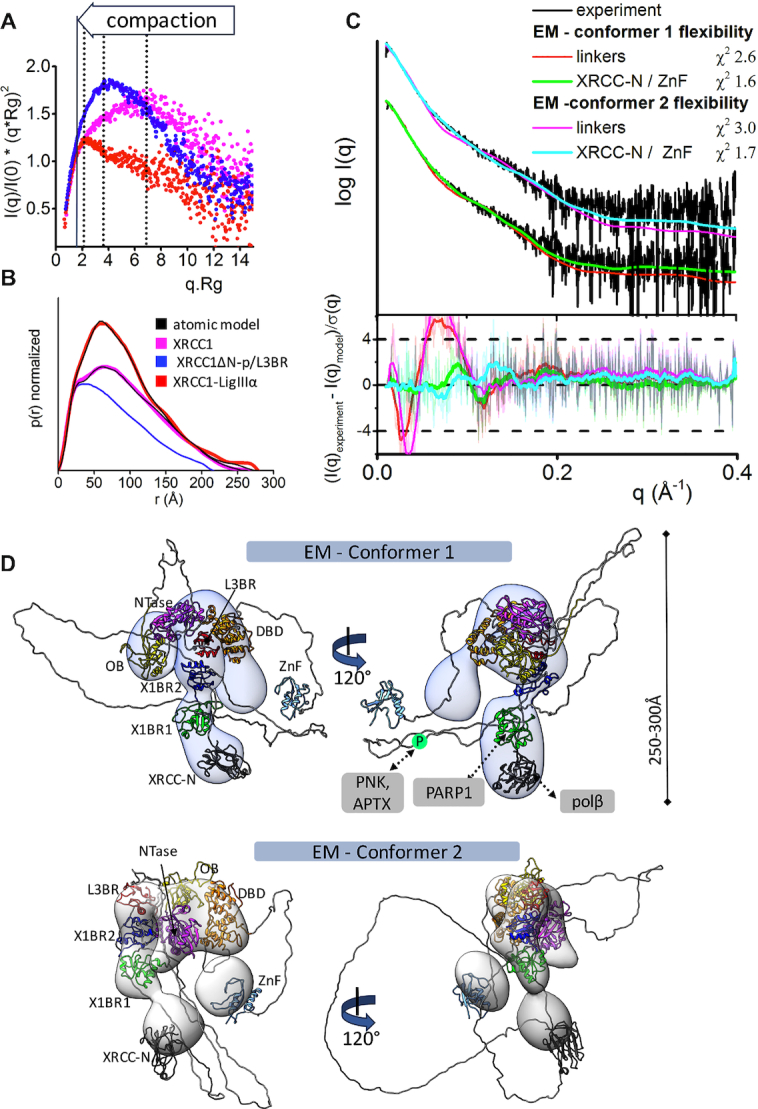
Figure 5.

Increased XL compaction from comparison of EM and SAXS results. (A) Normalized Kratky plot of XRCC1 (magenta) in comparison with XRCC1ΔN-p/L3BR (blue) and XL complex (red) revealed compaction of larger XL complexes. The SAXS profiles are representative of two independent experiments. (B) Normalized P(r) functions obtained for experimental SAXS shown in panel A fitted to the theoretical P(r) functions (black) of atomistic models of XRCC1 (Figure 2E) and the multistate model of XL complex derived from the EM conformer 1 shown in panel D. P(r) function of XRCC1ΔN-p/L3BR complex reveal that the XRCC1ΔN has an elongated, flexible conformation, even when bound to L3BR domain. (C) Experimental (black) and theoretical (colored as indicated) SAXS profiles for the two XL EM conformers with optimized conformations of the linker regions (red and magenta) and optimized locations of the N-terminal domain of XRCC1 and the LigIII N-terminal ZnF domain (XRCC-N, cyan and ZnF, green). SAXS fits are shown together with the fit residuals in the lower panel and χ2 values indicating goodness of fit. (D) The top weighted model from the multistate SAXS-model of XL complex was modelled using EM conformer 1 (top) and conformer 2 (bottom) as initial model. Both conformers of multistate models are shown in Supplementary Figure S12. Models are superimposed on to the 3D EM maps. Corresponding SAXS fits for the atomistic models are shown in panel C and further shown as a theoretical P(r) functions in panel B. XRCC1 is constitutively phosphorylated by CK2 (30), and the phosphorylation site is indicated by P within a green circle. Interacting regions of XRCC1 with partner proteins are indicated.
