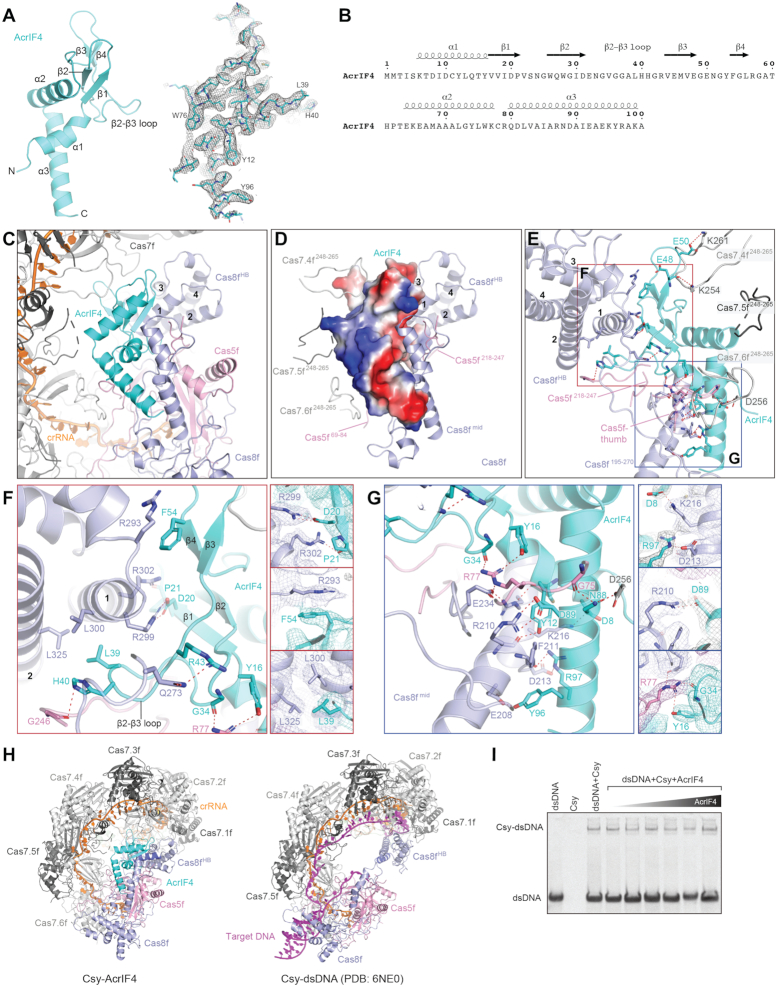
Figure 2.
Structure of AcrIF4 and its interactions with the Csy complex. (A) Atomic model of AcrIF4 in cartoon representation. Stick representation of AcrIF4 with corresponding cryo-EM map in mesh is shown on the right. (B) Amino acid sequence of AcrIF4 with secondary structures labeled. (C) Focused view of AcrIF4 and surrounding components in the Csy–AcrIF4 complex. (D) Surface potential of AcrIF4 shown in the same view as in C. The subunits of Csy in close contact with AcrIF4 are shown as cartoon representation, including Cas8fmid, Cas8fHB, loops in Cas7.4f (Cas7.4f248–265), Cas7.5f (Cas7.5f248–265), Cas7.6f (Cas7.6248–265) and Cas5f (Cas5f69–84and Cas5f218–247). (E) Detailed interactions between AcrIF4 and the Csy complex. Interactions are indicated by red dashed lines. Regions indicated by red and blue squares are shown in enlarged view in panels F and G, respectively. (F) Detailed interactions between the β-strand domain of AcrIF4 and Cas8fHB of the Csy complex. Focused views of side chain interactions are shown on the right, with cryo-EM density map shown in mesh. (G) Detailed interactions between the helical domain of AcrIF4 and Cas8fmid of Csy. Focused views of side chain interactions are shown on the right, with cryo-EM density map shown in mesh. (H) Side-by-side comparison of the Csy-AcrIF4 and Csy-dsDNA (PDB:6NE0) structures. (I) EMSA assays of dsDNA (100 nM) binding by the Csy complex (400 nM) in the presence of different concentrations of AcrIF4 (from left to right: 0.4, 4.0, 8.0, 16.0, 40.0 and 80.0 μM).

