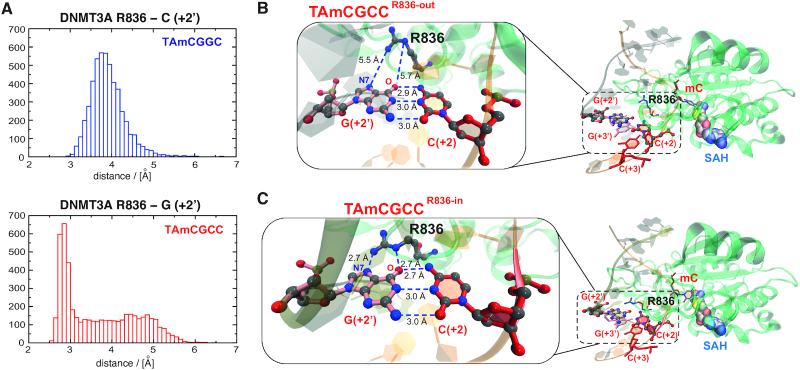
Figure 4.
Molecular dynamics simulations reveal potential mechanisms underlying DNMT3A preference for CpGpC sites. (A) Histograms displaying the measured distance between the R836 side chain and the base at position +2′ for the disfavored (top) and the favored (bottom) DNA duplex sequence. For the favored sequence, a broad region and a peak are observed corresponding to the state before the conformational switch (‘R836-out’ state) and after (‘R836-in’ state). (B, C) The two interactions states of DNMT3A R836 and the preferred DNA sequence obtained from the MD simulations. Magnifications show the distances between DNMT3A R836 and the guanine at position +2′ for the ‘R836-out’ (in B) and ‘R836-in’ state (in C). The hydrogen bonds between the nitrogen atoms of the guanidinium group of R836 and the carbonyl oxygen and N7 nitrogen of the guanine at position +2′ are indicated.

