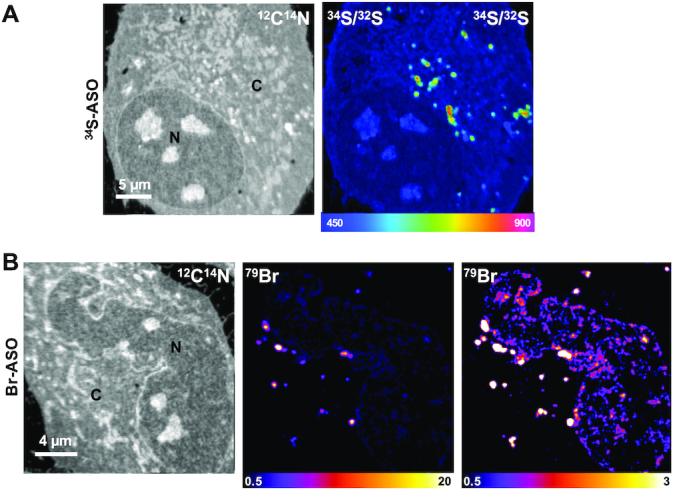
Figure 2.

NanoSIMS imaging of 34S-labeled and Br-labeled ASOs in HeLa cells. HeLa cells were incubated in medium containing (A) 34S-ASO or (B) Br-ASO for 24 h and then processed for NanoSIMS analyses. 12C14N images were useful for defining cell morphology; 34S/32S and 79Br NanoSIMS images show distributions of 34S-ASO and Br-ASO, respectively. Two 79Br images, with different scales, are shown to depict the relative distributions of the Br-ASO in the cytoplasm and nucleus. The 34S/32S ratio scale is multiplied by 10 000. N, nucleus; C, cytoplasm.
