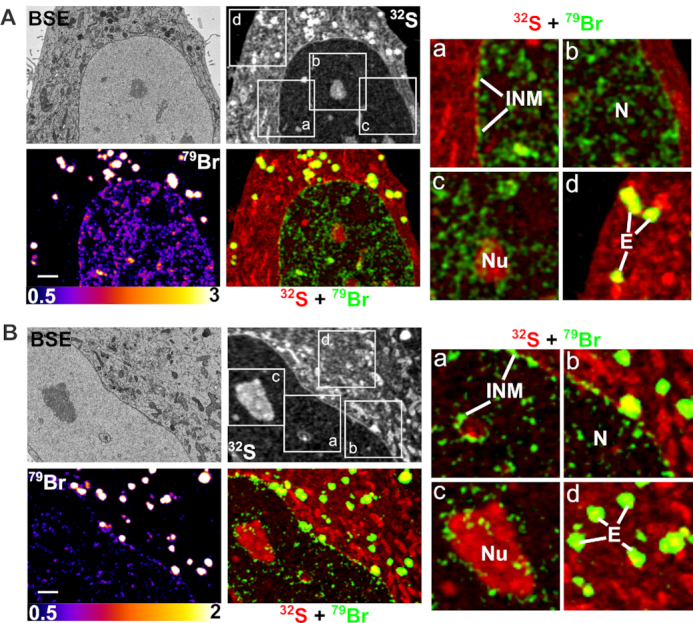
Figure 3.

Correlative backscattered electron (BSE) and NanoSIMS imaging of Br-ASO taken up into cells by ‘free uptake.’ HeLa cells were incubated in medium containing 5 μM Br-ASO for 24 h and then processed for BSE/NanoSIMS analyses. BSE and 32S NanoSIMS images are useful for cell morphology; 79Br and composite 32S (red) + 79Br (green) NanoSIMS images were generated to show distributions of Br-ASO within cells. Two cells (panels A and B) are shown. In each panel, boxed regions (a, b, c, d) are shown on the right in higher-magnification 32S (red) + 79Br (green) composite images; these images reveal the Br-ASO along the inner nuclear membrane (INM) and in the nucleoplasm (N), nucleolus (Nu) and endosomes (E). Scale bars, 2 μm.
