
Figure 4.
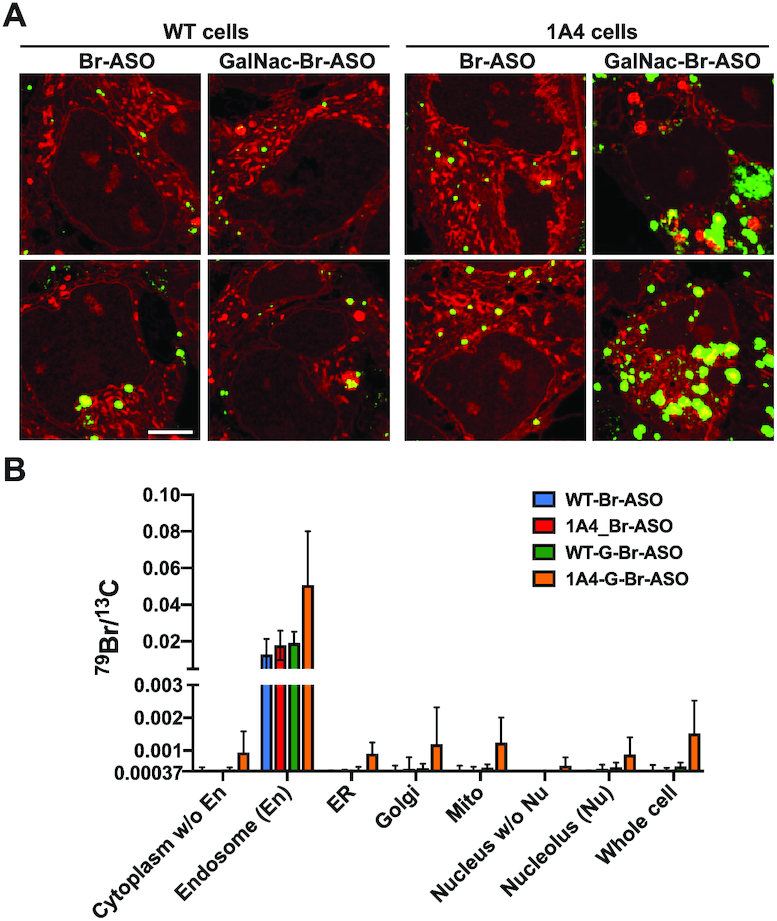
Examining the impact of a targeted ligand (GalNAc) and expressing a receptor for GalNAc (asialoglycoprotein receptor 1 (AGSR1) on ASO uptake and subcellular distribution of ASOs. Wild-type (WT) HEK293 cells or HEK293 cells stably expressing AGSR1 (1A4 cells) were incubated in medium containing 150 nM Br-ASO for 24 h (‘free uptake’) and then processed for NanoSIMS analyses. (A) Composite 32S (red) + 79Br (green) NanoSIMS images reveal the distribution of Br-ASO and GalNAc-Br-ASO in WT and 1A4 cells. Scale bars, 5 μm. Additional NanoSIMS images are shown in Supplementary Figures S8–S9. (B) Quantification of 79Br, normalized to 13C, in WT and 1A4 cells that had been incubated with Br-ASO or GalNAc-Br-ASO (mean ± SD). Signals were quantified in nucleolus (Nu), endosomes (En), nucleus, mitochondria (Mito), endoplasmic reticulum (ER), Golgi apparatus (Golgi), cytoplasm excluding endosomes, nucleoplasm, and whole cells. Numbers of cells evaluated: n = 6 for Br-ASO–treated WT cells; n = 9 for GalNAc-Br-ASO–treated WT cells; n = 8 for Br-ASO–treated 1A4 cells; n = 11 for GalNAc-Br-ASO–treated 1A4 cells. The 79Br/13C threshold was set at 0.00037 (corresponding to the 79Br/13C ratio in cells that were never incubated with an ASO). Data, presented as mean ± SD, were analyzed with one-way ANOVA with multiple comparisons. The 79Br/13C ratio in GalNAc-Br-ASO–treated 1A4 cells was higher than in the WT cells and higher than in Br-ASO–treated WT or 1A4 cells. P = 0.0031 for cytoplasm without endosomes; P = 0.0003 for endosomes; P <0.0001 for ER; P = 0.0961 for Golgi apparatus; P = 0.0006 for mitochondria; P = 0.0006 for nucleus without nucleolus; P = 0.0069 for nucleolus; P = 0.0004 for the whole cell.