Figure 6.
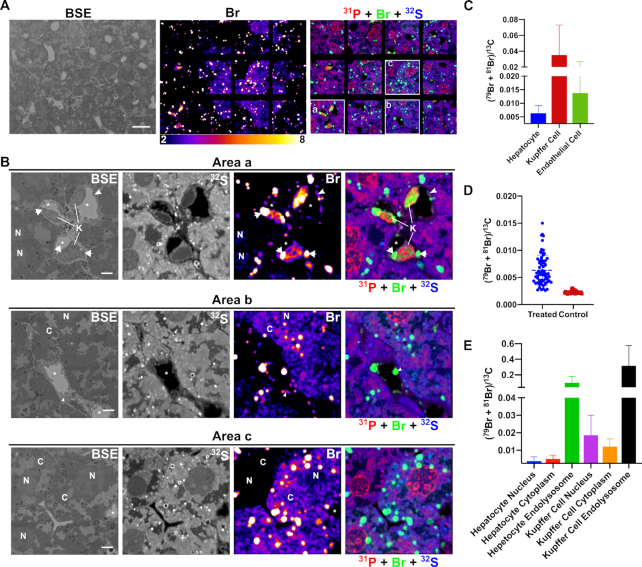
Correlative backscattered electron (BSE) and NanoSIMS mosaic images showing the distribution of Br-ASO in the liver. NanoSIMS imaging on a liver section from a mouse that had been injected subcutaneously with Br-ASO. After 72 h, liver was harvested and processed for NanoSIMS imaging. (A) BSE image; 32S and bromine (sum of 79Br and 81Br NanoSIMS images; and composite 31P (red) + Br (sum of 79Br and 81Br; green) and 32S (blue) NanoSIMS images of the liver. (B) Higher-magnification images of three boxed regions (Area a, Area b, Area c) from the NanoSIMS mosaic shown in panel A. 32S images were useful for morphology; the bromine and composite NanoSIMS images revealed an uneven distribution of Br-ASO in the liver. Br-ASO accumulation was observed in endolysosomes of hepatocytes and scattered cells within the liver parenchyma (Kupffer cells). Bromine levels were higher in hepatocytes in selected regions of the field. High levels of bromine enrichment were also observed in nuclei of Kupffer cells (K), cytoplasmic endolysosomes within Kupffer cells (arrows), capillary endothelial cells (arrowheads), and the cytoplasm (C) and nucleus (N) of hepatocytes. *capillary lumen; H, hepatocyte; K, Kupffer cell; N, cell nucleus. Scale bars: A, 20 μm; B, 4 μm. (C) Quantification of bromine signals (sum of 79Br and 81Br), normalized to 13C, in hepatocytes, Kupffer cells and capillary endothelial cells in the liver from a mouse that had been injected with Br-ASO. Numbers of cells evaluated: n = 68 for hepatocytes; n = 9 for Kupffer cells; n = 18 for capillary endothelial cells. The (79Br + 81Br)/13C threshold was set at 0.0025 (corresponding to slightly higher than the 79Br/13C ratio in liver cells from a control mouse that did not receive Br-ASO). Data is presented as mean ± SD. (D) Heterogeneity of bromine signals (sum of 79Br and 81Br), normalized to 13C, in hepatocytes in a liver section from a mouse had been injected with Br-ASO (treated) and a liver section from a mouse had not been injected with Br-ASO (control). Numbers of cells presented: n = 68 for hepatocytes from a treated mouse; n = 34 for hepatocytes from a control mouse. Each point represent data from one hepatocyte. The bromine background in the liver that had not exposed to Br-ASO is relatively homogeneous. (E) Quantification of bromine enrichment (sum of 79Br and 81Br), normalized to 13C, in subcellular features in hepatocytes and Kupffer cells from a mouse had been injected with Br-ASO. Numbers of features evaluated: n = 26 for hepatocyte nucleus; n = 44 for hepatocyte cytoplasm (excluding endolysosomes); n = 159 for hepatocyte foci; n = 8 for Kupffer cell nucleus; n = 9 for Kupffer cell cytoplasm (excluding endolysosomes); n = 7 for Kupffer cell foci. The (79Br + 81Br)/13C threshold was set at 0.0025 (corresponding to slightly higher than the 79Br/13C ratio in the liver cells from a mouse that were never injected with Br-ASO). Data is presented as mean ± SD.

