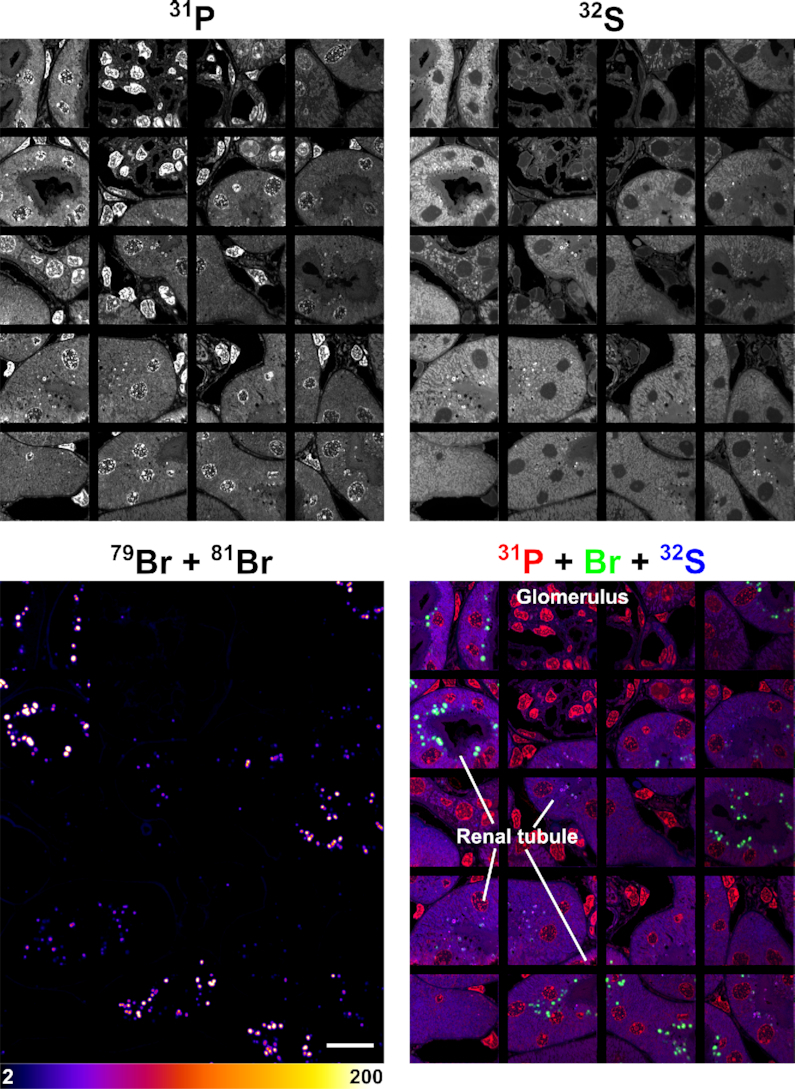
Figure 8.

NanoSIMS images of the same kidney section shown in Figure 4, revealing the distribution of Br-ASO in the kidney. Shown here are 31P, 32S, 79Br, and composite 31P (red) + 32S (blue) + 79Br (green) NanoSIMS images of kidney from a mouse that had been injected subcutaneously with Br-ASO. Images show localized areas of Br-ASO enrichment (endolysosomes) in renal tubule cells. Scale bars, 20 μm.
