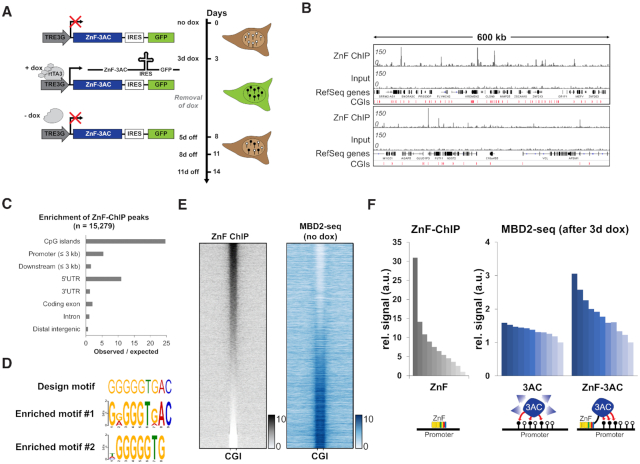
Figure 1.
Zinc finger targeted de novo DNA methylation by the catalytic domain of DNMT3A in HEK293 cells. (A) Stable HEK293 cell line containing a zinc finger (ZnF) fused to the catalytic domain of DNMT3A (3AC) under the control of a doxycycline (dox) inducible promoter. By the addition of dox, the reverse tetracycline-controlled transactivator 3 (rtTA3) can bind the TRE3G promoter and induce the expression of ZnF-3AC. Green fluorescent protein (GFP) is co-expressed with ZnF-3AC using an internal ribosomal entry site (IRES). After 3d of dox treatment, cells are sorted by FACS and grown after removal of dox for another 5–11 days (5–11 days off). Black lollipops indicate methylated DNA, white lollipops unmethylated DNA. (B) Representative browser views of crosslinked-ChIP of HA-tagged ZnF in transiently transfected HEK293 cells with the corresponding input. Two genomic regions are shown, chr16:2761829–3371040 (upper panel) and chr10:75371741–75993358 (lower panel, both in hg19). CGIs, CpG islands. (C) ZnF-ChIP peaks were called by MACS2 and their observed over expected occurrence in genomic elements was analyzed. (D) Originally designed target motif of the ZnF compared to the motifs enriched in ZnF-ChIP peaks as determined by DREME. (E) Heatmap of ZnF-ChIP signals in CGIs with 5 kb flanks sorted by intensity. MBD2-seq data in ‘no dox’ state are displayed in the same order. (F) Signal of ZnF-ChIP in unmethylated CGIs (n = 10 910) sorted and binned into groups of 1000 (left panel). Means of the groups are depicted in the bar diagram. Mean signals of MBD2-seq data of 3AC without ZnF (middle panel) and 3AC with ZnF fusion (right panel) are displayed in the same order. The schemes below the bar diagrams illustrate the corresponding experimental setting.

