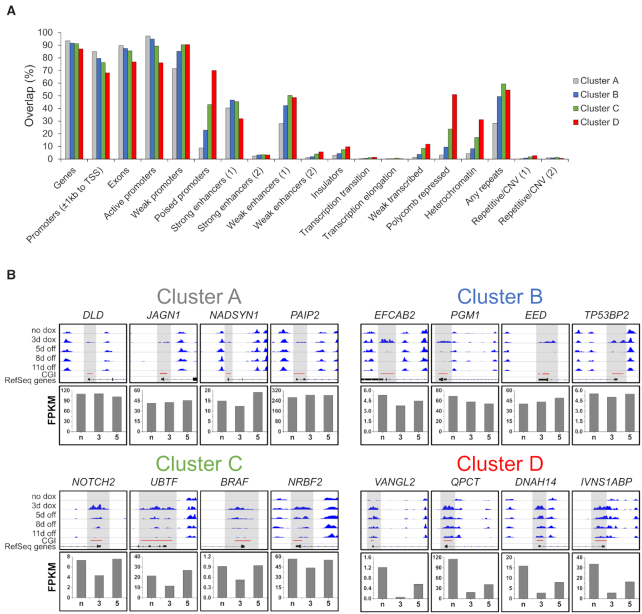
Figure 3.
Enrichment of the differentially methylated clusters A–D in various chromatin states and examples for the dynamics in gene expression. (A) Chromatin state segmentation for clusters A–D prepared using EpiExplorer (https://epiexplorer.mpi-inf.mpg.de/) (53). (B) Representative browser views of MBD2-seq data in different clusters and expression data of corresponding genes. The upper boxes show browser views of MBD2-seq data (data range 0–80) generated using the Integrative Genomics Viewer (IGV). Regions showing de novo methylation are highlighted in gray. Clusters A–D exhibit differential DNA methylation dynamics over the time course of the experiment. The lower boxes show the RNA-seq FPKM values of genes associated with the CGIs displayed as bar diagrams. The expression of the genes shows a methylation-dependent dynamic. N, no dox; 3, 3d dox; 5, 5d off. The corresponding genomic regions are listed in Supplementary Table S4.

