Figure 6.
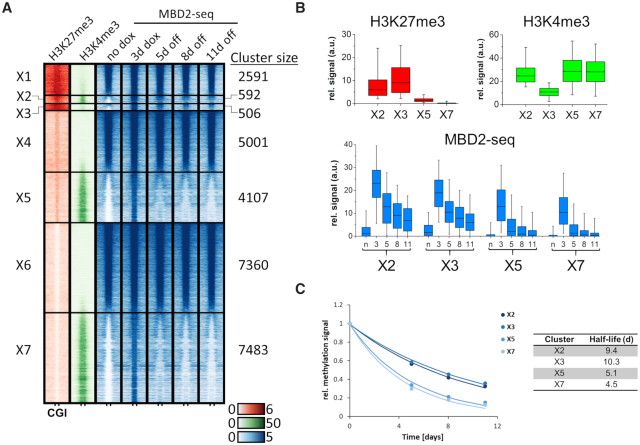
Alternative CGI clustering based on initial H3K27me3, H3K4me3 and DNA methylation (no dox) revealed an influence of H3K27me3 on DNA methylation stability. (A) Heatmaps are centered around CGIs with 2.5 kb flanks on either side showing H3K27me3 and H3K4me3 ChIP-seq signals at ‘no dox’ and MBD2-seq signals at the different time points of ZnF-3AC induction. K-means clustering was performed first for H3K27me3, then based on H3K4me3 and MBD2-seq. Clusters are labeled with ‘X1–7’. (B) Boxplots showing the H3K27me3, H3K4me3 and MBD2-seq signals in the selected clusters X2, X3, X5 and X7. The line in the box indicates the median, the box indicates the 25th and 75th percentile, the whiskers the 5th and 95th percentile. n, no dox; 3, 3d dox; 5/8/11, 5d/8d/11d off. (C) The average methylation levels of clusters X2, X3, X5 and X7 were fitted to a single exponential decay curve to determine the half-lives of the methylation. The figure shows the average methylation levels as data points and fits as lines.

