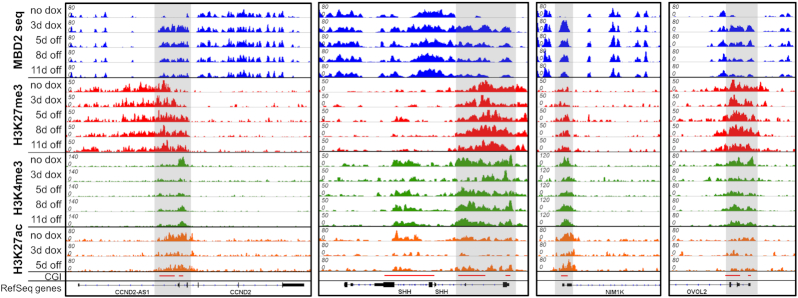
Figure 7.
Example of the epigenome landscape in regions showing stable DNA methylation. Browser views of MBD2-seq, H3K27me3-ChIP, H3K4me3-ChIP and H3K27ac-ChIP at representative loci generated with IGV. Regions showing strong de novo DNA methylation are highlighted in gray. Shown are example regions illustrating the stable introduction of DNA methylation in CGIs with high H3K27me3 signal. Strong, but transient reductions of H3K4me3 and H3K27ac were observed at these loci. The corresponding genomic regions are listed in Supplementary Table S5.

