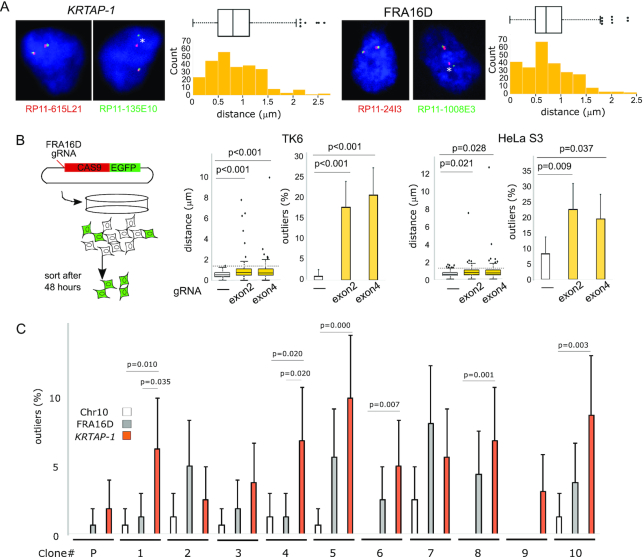
Figure 2.
Spontaneous breaks at KRTAP-1. (A) Measurements of the distance between both ends of KRTAP-1 and FRA16D. Representative photomicrographs of FISH of the nuclei of IMR-90 are shown. The asterisks (*) show that the distance between the probe pair is a statistical outlier. The distributions of the distances (n = 250) are depicted by box plots and histograms. Outliers are plotted at their exact lengths. (B) The distribution of distances between probes before and after CRISPR/Cas9-targeted breaks at FRA16D in TK6 and HeLa S3 cells. (left) A schematic drawing of the experimental procedure. (right) The box plots depict distributions of the distances (n = 100), with outliers plotted at their exact distances. P-values were determined by one-tailed Mann-Whitney U test. The horizontal dotted lines indicate thresholds for outliers determined by the cells without the CRISPR/Cas9-targeted breaks. The histograms depict the frequencies of outliers. Error bars represent 95% confidence intervals. P-values were determined by Fisher's exact test. (C) Frequencies of breaks in 10 single cell-derived TK6 clones. The histogram depicts the frequency of outliers. (P): parental TK6 cell population. Error bars represent 95% confidence intervals. P-values determined by Fisher's exact test are shown for the clones with a statistically significant difference between KRTAP-1 and FRA16D or Chr10 (the region centromeric to a rare fragile site FRA10A).

