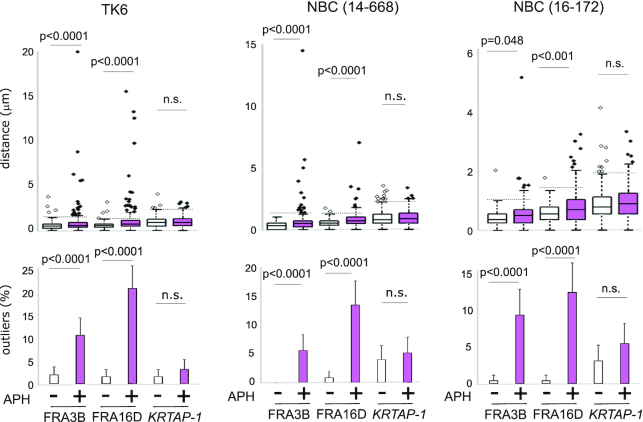
Figure 3.
Aphidicolin-induced breaks at KRTAP-1. The box plots (top) showing the distribution of distances between the flanking probes for KRTAP-1, FRA16D, and FRA3B in TK6 and a primary human mammary epithelial cell (NBC 14–668 and 16–172) with or without aphidicolin treatment (24 h). For each locus, the distances between the pair of probes were measured for 250 pairs. P-values were determined by Mann–Whitney U test. The horizontal dotted lines indicate thresholds for the outliers for cells without aphidicolin treatments. The histograms (bottom) depict the frequencies of outliers. Error bars represent 95% confidence intervals. P-values were determined by Fisher's exact test. n.s.: not significant.

