Figure 4.
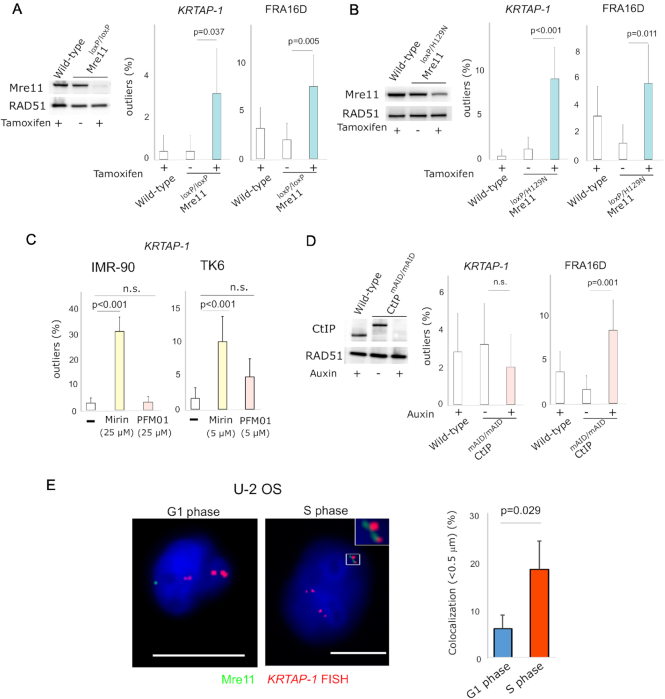
Depletion of Mre11 induces breakage in KRTAP-1. (A) TK6 cells with tamoxifen-inducible knockout of Mre11. Western blot shows Mre11 protein level before and after 5 days of tamoxifen treatment. RAD51 protein level is shown as a control. The histograms depict the frequencies of outliers. Error bars represent 95% confidence intervals. P-values were determined by Fisher's exact test. (B) TK6 cells with tamoxifen-inducible knockout of wild-type Mre11 for the exclusive expression of the nuclease-deficient Mre11 (H129N). Western blot shows Mre11 protein level before and after 5 days of tamoxifen treatment. RAD51 protein level is shown as a control. The histograms depict the frequencies of outliers. Error bars represent 95% confidence intervals. P-values were determined by Fisher's exact test. (C) Distinct effects of an exonuclease (Mirin) and an endonuclease (PFM01) inhibitor of Mre11 on breaks in KRTAP-1 in IMR-90 and TK6 cells. The histograms depict frequencies of outliers at KRTAP-1 and FRA16D. Error bars represent 95% confidence intervals. P-values were determined by Fisher's exact test. n.s.: not significant. (D) Auxin-inducible depletion of CtIP in TK6 cells expressing CtIP fused with mAID. Western blot shows the CtIP protein level before and after 3 days of auxin treatment. RAD51 protein level is shown as a control. The histograms depict the frequencies of outliers. Error bars represent 95% confidence intervals. P-values were determined by Fisher's exact test. n.s.: not significant. (E) Representative photomicrographs of the nuclei of U-2 OS cells in G1 phase and S phase after staining with anti-Mre11 antibodies (green) and hybridization of FISH probes for KRTAP-1 (red). Scale bars = 10 μm. The histogram depicts the fraction of nuclei with the co-localization of Mre11 foci and KRTAP-1. The averages of three experiments are shown. P-value was calculated with two-tailed t-test.

