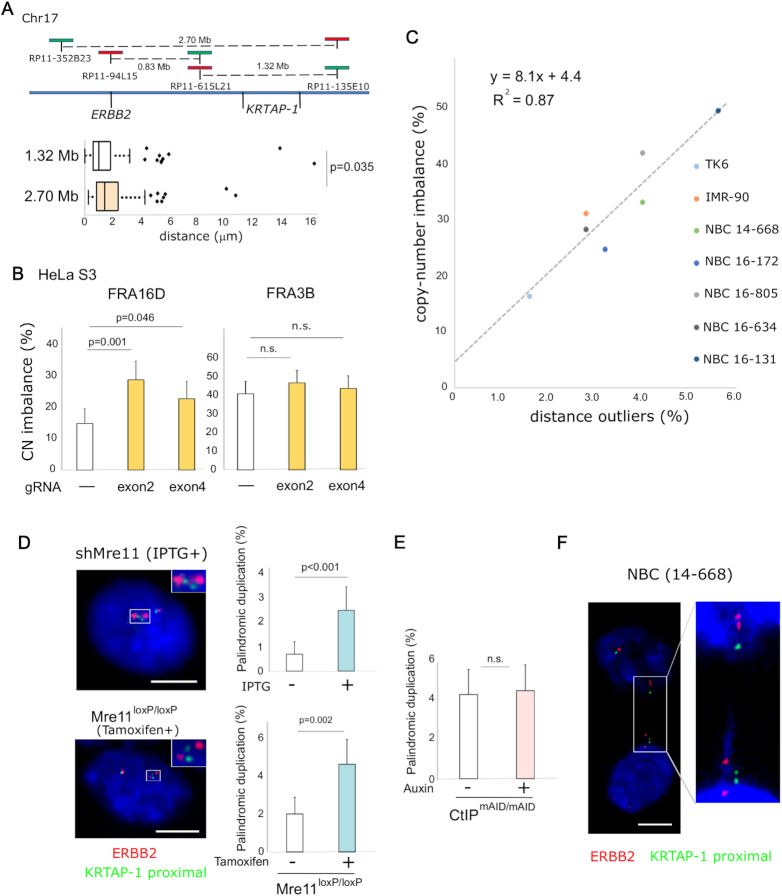
Figure 5.
Breaks at KRTAP-1 trigger palindromic duplication and BFB cycles for the amplification of ERBB2. (A) KRTAP-1 is the primary fragile site in the region surrounding ERBB2. A schematic drawing of the locations of probes (top). The box plot (bottom) depicts the distributions of distances between probes in interphase nuclei of NBC (16–131; n = 170). Outliers are plotted at their exact distances. A P-value determined by one-tailed Mann-Whitney U test is shown. (B) Frequencies of copy-number imbalances between two flanking probes for FRA16D and FRA3B in HeLa S3 cells 7 days after the introduction of breaks at FRA16D with CRISPR/Cas9. The fraction of nuclei exhibiting copy number imbalances (n = 200) is shown in the histogram. Error bars represent 95% confidence intervals. P-values were determined by Fisher's exact test. n.s.: not significant. (C) A scatter plot showing a positive correlation (R2 = 0.87) between frequencies of outliers and frequencies of copy-number imbalances at KRTAP-1. Data were collected from untreated TK6, IMR-90, and five NBCs (14–668, 16–172, 16–805, 16–634 and 16–131; n = 250). (D) Frequency of palindromic duplication before and after depletion of Mre11 in the IPTG-inducible Mre11 knockdown in RKO cells (top) and the Cre/loxP-inducible Mre11 knockout in TK6 cells (bottom). Histograms show the frequency of cells with two ERBB2 (red; RP11–94L15 in Figure 5A top) signals flanking one or two green (KRTAP-1 proximal; RP11–615L21 in A, top) signals (as shown by an asterisk in Supplementary Figure S1A). Error bars represent 95% confidence intervals. P-values were determined by Fisher's exact test. (E) Frequency of palindromic duplication before and after depletion of CtIP in the mAID-inducible depletion of CtIP in TK6 cells. Histograms show the frequency of nuclei with palindromic duplication: two ERBB2 (red; RP11–94L15 in Figure 5A top) signals flanking one or two green (KRTAP-1 proximal; RP11–615L21 in Figure 5A top) signals (as shown by an asterisk in Supplementary Figure S1A). Error bars represent 95% confidence intervals. P-values were determined by Fisher's exact test. n.s.: not significant. (F) Photomicrographs showing dividing nuclei with a chromatin bridge carrying multiple ERBB2 and KRTAP-1 loci in NBC (14–668). FISH visualizes ERBB2 (red; RP11–94L15 in A, top) and the centromere-proximal region of KRTAP-1 (KRTAP-1 proximal; green; RP11–615L21 in A, top). Scale bars = 10 μm.

