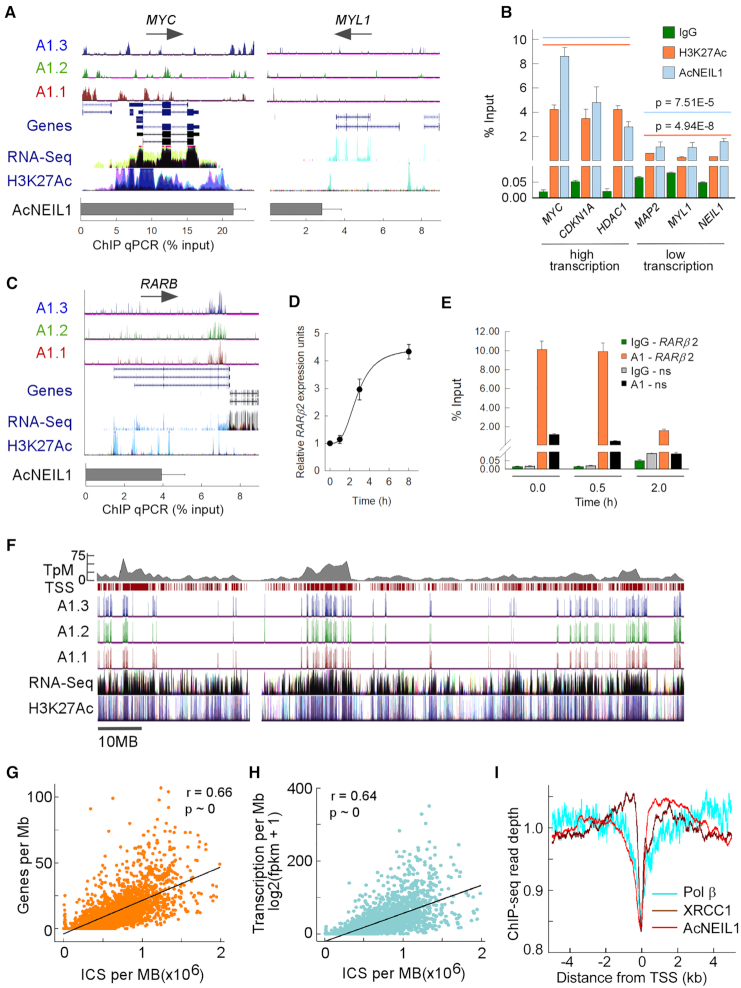
Figure 4.
Gene-dense and highly transcribed domains are enriched in AcNEIL1. (A) ChIP-seq enriched peaks for the AcNEIL1 replicates visualized on the UCSC genome browser in ln(logLR + 1) units (range = 0–3, top) with splicing isoforms (Genes) and direction of transcription (arrows); transcriptional profiling (RNA-seq) and histone H3 acetylated at Lys27 (H3K27Ac,) from ENCODE; AcNEIL1 ChIP qPCR quantitation (% relative to Input) at a strongly (MYC, left) and weakly (MYL1, right) transcribed gene. (B) AcNEIL1 and H3K27Ac ChIP qPCR quantitation (from A). Results represent the mean ± SEM; n = 4. P-values are from Welch's t-tests for the aggregate data at high (orange, 14.1 ± 3.2 mean ± SD) versus low transcription (blue, 3.2 ± 1.7 mean ± SD). (C–E) Modulation of promoter-specific AcNEIL1 levels during RA-induced transcriptional activation of RARB in HEK293 cells. (C) As in A for the RARB gene in HCT116 cells showing the paucity of AcNEIL1 peaks at TSSs. (D) RARB expression by RT-PCR normalized to HPRT1 expression; mean ± SEM, n = 3. (E) AcNEIL1 ChIP qPCR for the −165 to +82 region containing RARE on the RARB promoter versus a non-specific (ns) control region on chromosome 17 with no RARE after RA treatment; mean ±SEM, n = 3. (F) UCSC genome browser custom tracks for AcNEIL1 ICS peaks, as in A, for chromosome 1, showing all TSSs (maroon ticks) and gene density in TSS/Mb (top gray). (G) Plot of AcNEIL1 ICS (x-axis) for A1.2 versus gene density. Each point represents the integration over 1 Mb of ICS with FE (fold enrichment) output and the number of annotated TSSs over the same genomic region (y-axis). (H) As in G, the y-axis represents the RNA-seq fpkm data from averaged normal tissues from (22). (I) Profile of aggregate Chip-seq read depth near TSSs in HCT116 cells for AcNEIL1, XRCC1 and Pol β. Signals were normalized by the total amount of signal within the −5–5 kb interval.

