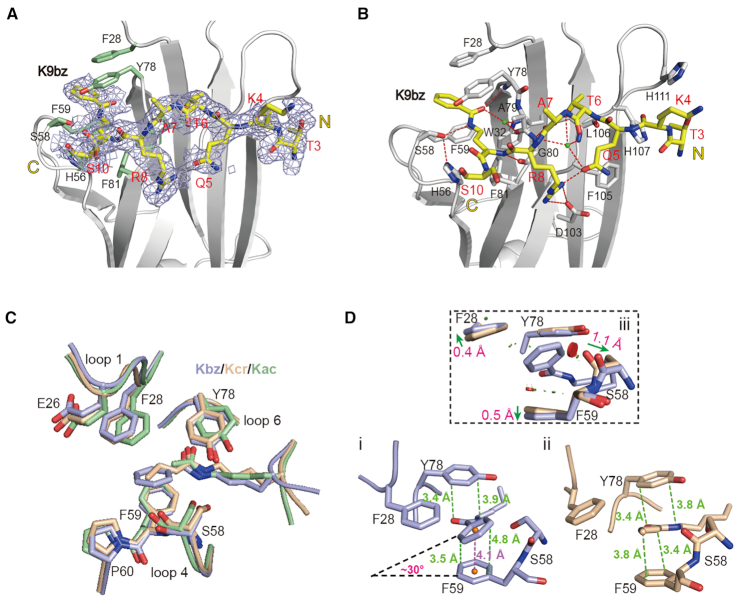
Figure 3.
Molecular recognition of histone benzoylation by AF9YEATS. (A) Fo-Fc omit map of H3K9bz peptide contoured at 2.0 σ level. Histone peptide is shown as yellow sticks. Key residues of AF9YEATS are depicted as pale green sticks. Light blue meshes, Fo-Fc omit map. (B) Hydrogen bonding networks between H3K9bz peptide and AF9YEATS. (C) Structure alignment of K9bz-bound (light blue), K9ac-bound (pale green, PDB ID: 4TMP) and K9cr-bound (wheat, PDB ID: 5HJB) structures. (D) π–π stacking analyses of (i) K9bz and (ii) K9cr in AF9YEATS reader pocket and its local conformational adjustments (iii). Distances measured between atoms or centroids are color-coded in green or magenta, respectively. Symbols of close contacts are as described for Figure 2D. Green arrows, conformational displacement comparing Kbz and Kcr readout.

