Figure 1.
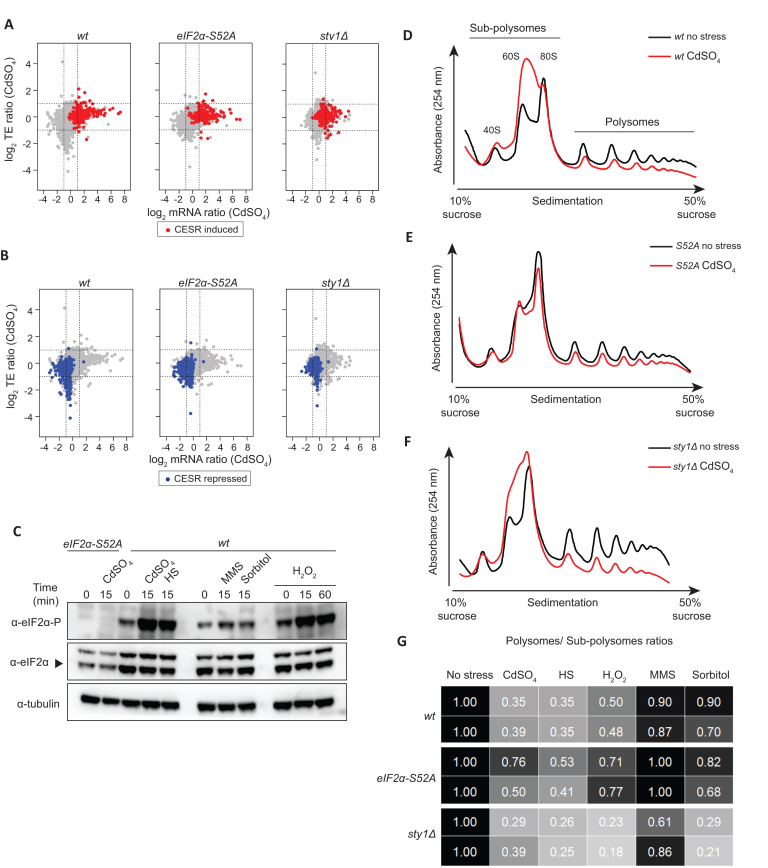
General responses to stress. (A) Scatter plot comparing mRNA levels and translation efficiencies (log2 ratios stress/control) upon cadmium treatment (15 min) in wild type, eIF2α-S52A and sty1Δ genetic backgrounds. CESR-induced genes are plotted in red. (B) Same dataset as in A, but CESR-repressed genes are highlighted in blue. (C) Western blots comparing eIF2α phosphorylation levels after the five treatments for the indicated times in wild type cells. In the first two lanes (left), eIF2α-S52A cells were used as negative control for the anti-eIF2α phosphorylation antibody. Tubulin was employed as a loading control. (D–F) Representative polysome profile traces before and after cadmium treatment (15 min) in wild type (D), eIF2α-S52A (E) and sty1Δ cells (F). (G) Quantification of polysomes to subpolysomes ratios after five stress treatments (15 min). The data are normalised to control unstressed cells. Unnormalized values are presented in Supplementary Figure S2B. The data are shown for two independent biological replicates of each experiment.

