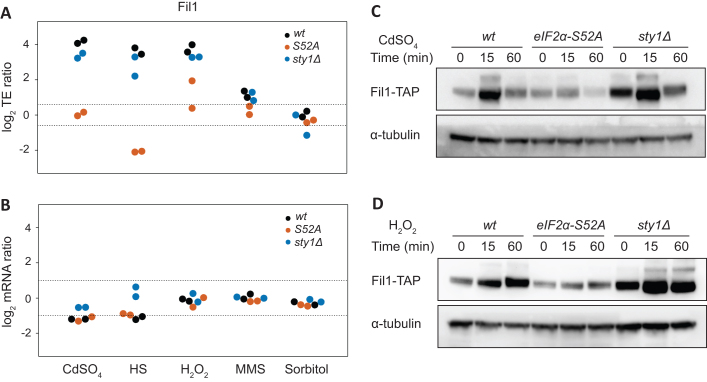
Figure 3.
Fil1 is the major translational responder to stress. (A) Comparison of translation efficiency of the fil1 gene between stressed and control cells (log2 ratios stress/control). The dotted lines indicate 1.5-fold changes. Data are presented for wild type, eIF2α-S52A and sty1Δ cells. (B) As in C, but for fil1 mRNA changes. The dotted lines indicate 2-fold changes. (C) Western blots to measure Fil1-TAP protein levels after cadmium treatment for the indicated times. Data are presented for wild type, eIF2α-S52A and sty1Δ cells. Tubulin was used as a loading control. (D) As in C, but after H2O2 treatment.

