Figure 4.
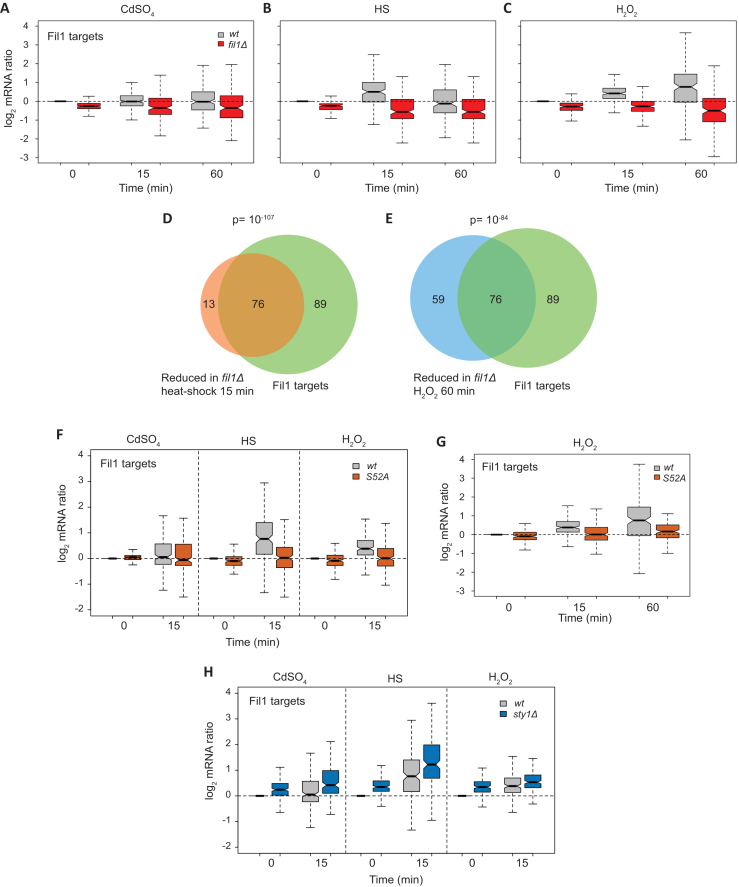
Role of Fil1 in the transcriptional responses to stress. (A–C) Boxplots comparing mRNA levels of stressed and control cells (log2 ratios stress/control) of Fil1 targets. Data are shown for wild type and fil1Δ cells at the indicated times and stresses. (D) Venn diagram showing the overlap between genes expressed at lower levels in fil1Δ mutant relative to wild type cells after heat shock (15 min), and Fil1 targets in unstressed cells. The P value of the observed overlap is shown. (E) As in D, but genes expressed at lower levels in fil1Δ mutant relative to wild type after H2O2 treatment (60 min) were compared to Fil1 targets in unstressed cells. (F) As in A to C, but after cadmium, heat shock and H2O2 treatments, in wild type and eIF2α-S52A strains. (G) As in F, but after H2O2 treatment and with an additional time point. (H) As in F, but in the wild type and sty1Δ strains.

