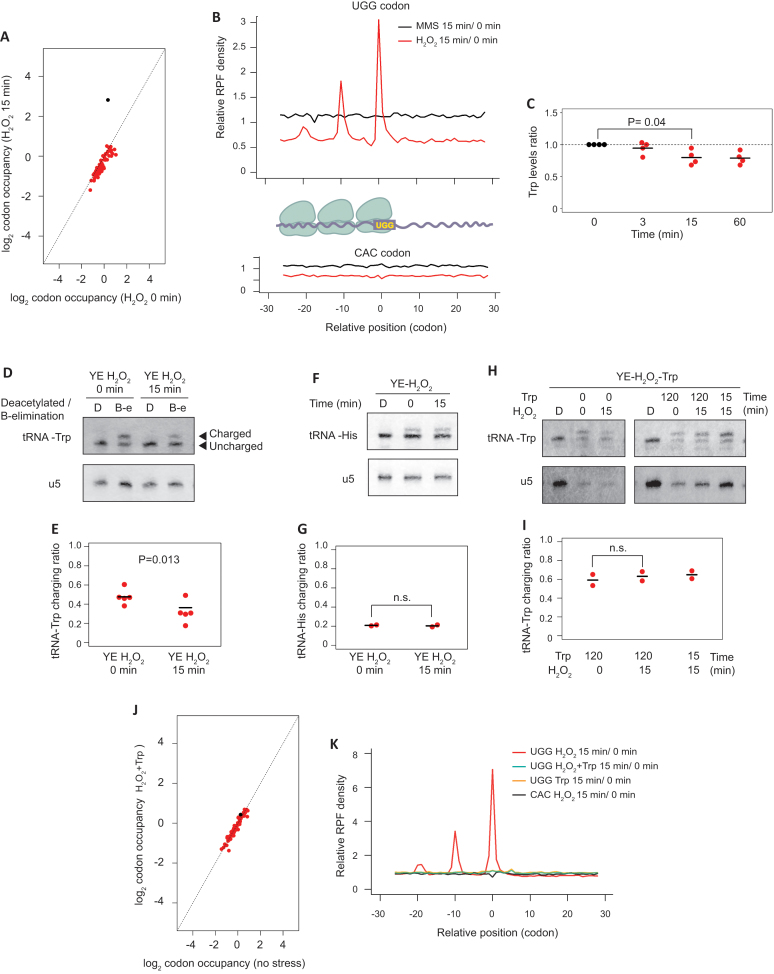
Figure 5.
Levels of charged tRNA-Trp are affected by oxidative stress. (A) Scatter plots showing log2 relative codon occupancies before and after H2O2 treatment for 15 min in wild type cells. The dot corresponding to UGG codon encoding tryptophan is shown in black. (B) Metagene depicting average read density of RPFs around tryptophan codons (UGG) or one of the histidine codons (CAC). The cartoon shows the interpretation of the results of the experiment, with ribosomes queuing upstream of the tryptophan codon-stalled ribosome. (C) Changes in intracellular tryptophan levels in response to H2O2 exposure. Tryptophan levels were measured at the indicated times after H2O2 addition to the culture medium. Each dot corresponds to an independent biological replicate (n = 4), and the horizontal lines indicate the means. No adjustment for multiple testing was performed. (D) Representative northern blot for the determination of tRNA-Trp charging levels before and after H2O2 exposure. The top blot was hybridised with a probe against tRNA-Trp, and the bottom one with a probe against the U5 snRNA. In the upper blot, the top band corresponds to charged tRNA, and the bottom to the uncharged form. tRNA-Trp samples were either deacylated to remove the linked amino acid from charged tRNAs (sample D) or oxidised to remove the unprotected 3′ nucleotides from uncharged tRNAs by beta-elimination (sample B–E) (see Materials and Methods for details). U5 snRNA was used as a loading control. (E) Quantification of tRNA-Trp charging ratios from experiment D. Ratios between charged and uncharged tRNA were calculated. Each dot corresponds to an independent biological replicate (n = 5), and the horizontal line indicates the mean. (F) As in D, but using a probe against tRNA-His (top panel) or U5 snRNA (bottom). (G) Quantification of tRNA-His charging from the experiment shown in F (n = 2 independent replicates). (H) Northern blot as in D, to explore the effects of supplementing the culture medium with tryptophan. Cells were grown in the presence of tryptophan for 0, 15 or 120 min, and H2O2 was added at the indicated times (0, 15 min) before the end of the incubation with tryptophan. Control deacylated RNA (sample D) is used to identify the location of uncharged tRNA. (I) Quantification of tRNA-Trp charging levels from experiment H, right panels (n = 2 independent replicates). (J) Scatter plots showing log2 relative codon occupancies before and after H2O2 and tryptophan treatment for 15 min in wild type cells. The dot corresponding to the UGG codon, encoding tryptophan, is shown in black. (K) Metagene depicting average read density of RPFs around tryptophan codons (UGG) or one of the histidine codons (CAC) in different conditions.

