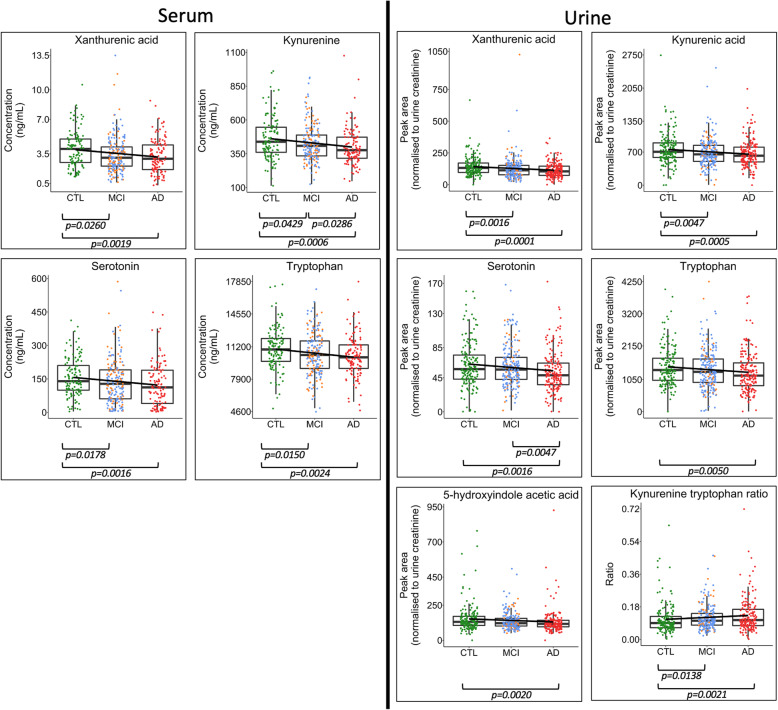
Fig. 2.
Inter-group metabolite differences. Boxplots highlighting differences between metabolite concentrations in serum and urine when comparing AD (red), MCI (blue = sMCI, yellow = cMCI) and age-matched controls (CTL—green). Boxplots are shown for metabolites in the serotonin and kynurenine pathways that reported significant differences following univariate Kruskal-Wallis tests. Figure p values were calculated using Dunn’s post hoc test for those metabolites that reported a Kruskal-Wallis p value < 0.1 following adjustment for multiple testing using the Holm method. A decreasing trend was observed: control > MCI > AD for each metabolite. This trend was observed regardless of gender (Fig. 3). Boxplots for all metabolites are presented in Fig. S1 and S2

