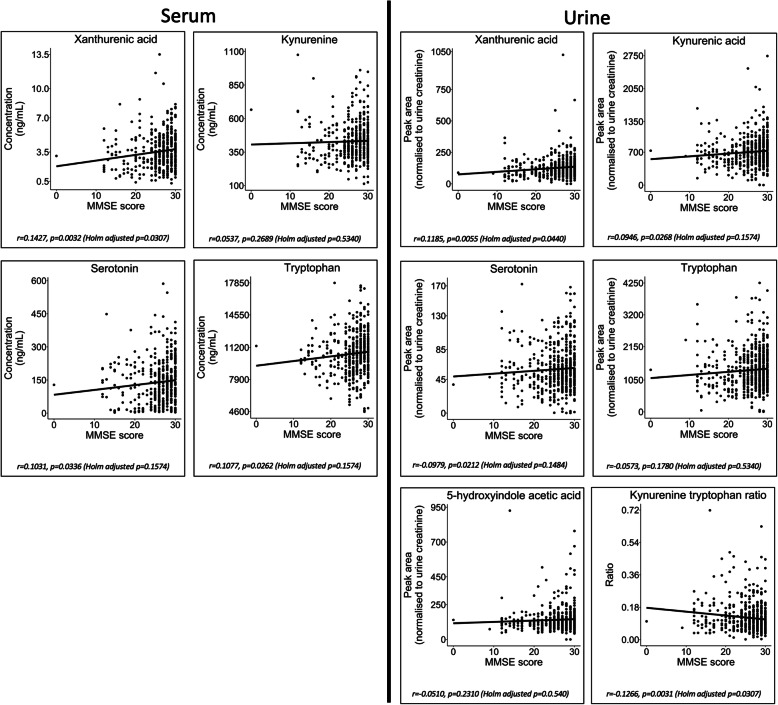
Fig. 5.
Serum and urine metabolite associations with participant MMSE scores. Plots presenting metabolite concentration change in association with participant Mini-Mental State Examination (MMSE) score. The plots were fitted with a linear regression model. Plots are shown for the metabolites in the serotonin and kynurenine pathways that reported significant differences between participant groups (Supplementary Figs. S1 and S2). The plots suggest that only urine xanthurenic acid has a significant negative correlation with participant MMSE (r = − 0.1266, p = 0.0031 (Holm-adjusted p = 0.0307)). A significant positive correlation was observed between MMSE score and both urine kynurenic acid (r = 0.1427, p = 0.0032 (Holm-adjusted p = 0.0307)) and serotonin (r = 0.1185, p = 0.0055 (Holm adjusted))

