Fig. 9.
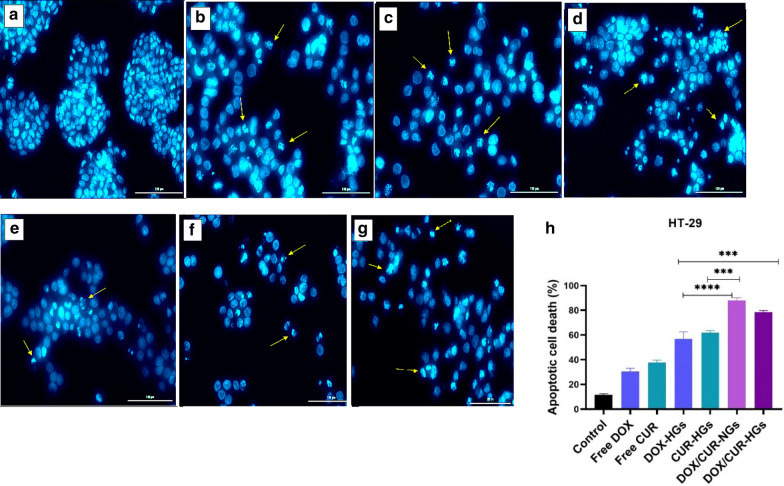
Nuclear morphology changes and apoptotic cell proportion in HT-29 cells. Fluorescence microscopy images of nuclear morphology in HT-29 cells after 48 h exposure to the a Untreated cells (control), b Free DOX, c Free CUR, d DOX-HGs, e CUR-HGs, f DOX/CUR-NGs, g DOX and CUR-HGs. h The percentages of apoptotic cell death in HT-29 cells after being exposed to free drugs, single/dual drug-loaded nanocarriers. To determine the proportion of apoptotic cells, more than 100 stained cells were counted. As depicted in the diagram, dual drug-loaded nanocarriers induced highly significant apoptosis (P < 0.001) in comparison to single drug-loaded nanocarriers. The images were processed using ImageJ Software [43]. Comparison among groups was conducted by one-way ANOVA, *p < 0.05, ** p < 0.01, *** p < 0.001

