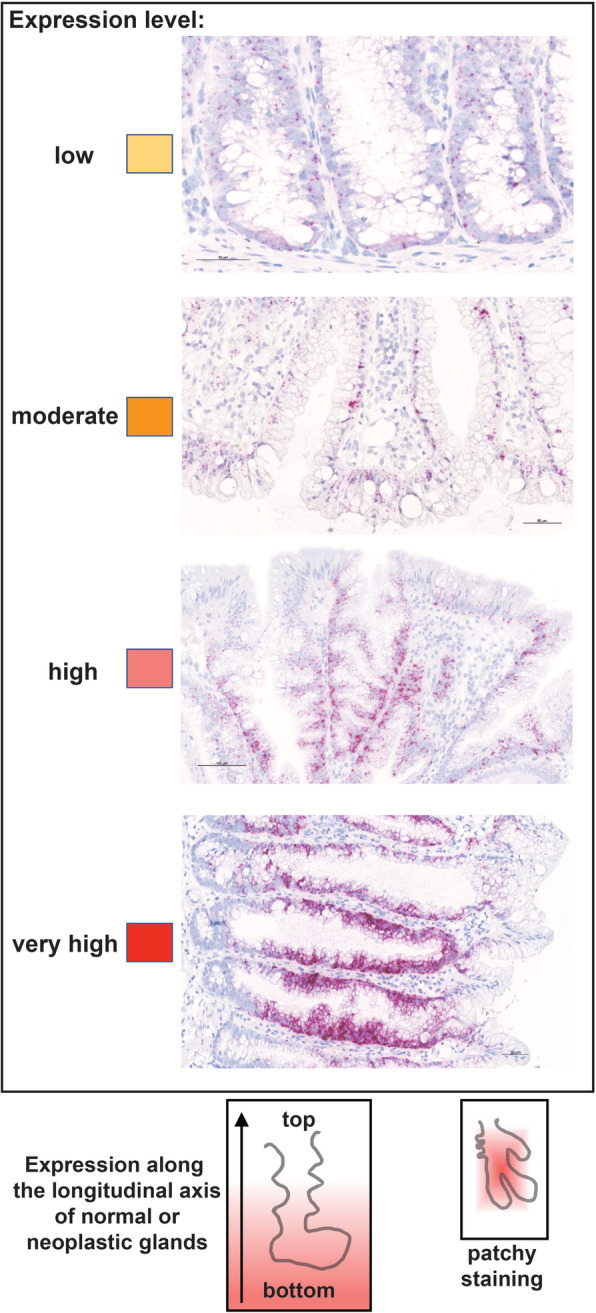
Fig. 1.

RNA-expression scoring of colorectal tissue sections. Intensity and distribution of epithelial cell expression of target RNAs were assessed in the entire section. IHC staining intensity was classified as low, moderate, high, or very high based on the number and size of dots and dot aggregates in the epithelial cells. Each score is color-coded according to the yellow-to-red scale used in Table 1. ISH staining distribution patterns were classified as shown in the schematics at the bottom of this figure: (left) staining distributed along the entire length of the longitudinal axis of normal and neoplastic glands, from the bottom to the luminal portion, in regions of the section where the specimen was properly oriented; (right) “patchy staining” consisting of stained and unstained regions within the same section, which is depicted as a rectangular gradient fill whose area is proportional to the prevalence and size of the stained patches across the section. Both staining distribution features are also depicted in Table 1 for each RNA. Distribution of staining along the longitudinal crypt axis was generally more common in normal mucosa, HPs, and SSLs (well-oriented specimens of flat or slightly elevated lesions); patchy staining patterns were found mainly in polypoid cADNs and TSAs, whose thick epithelium often contains intricately-folded, dysplastic glands
