
Fig. 6.
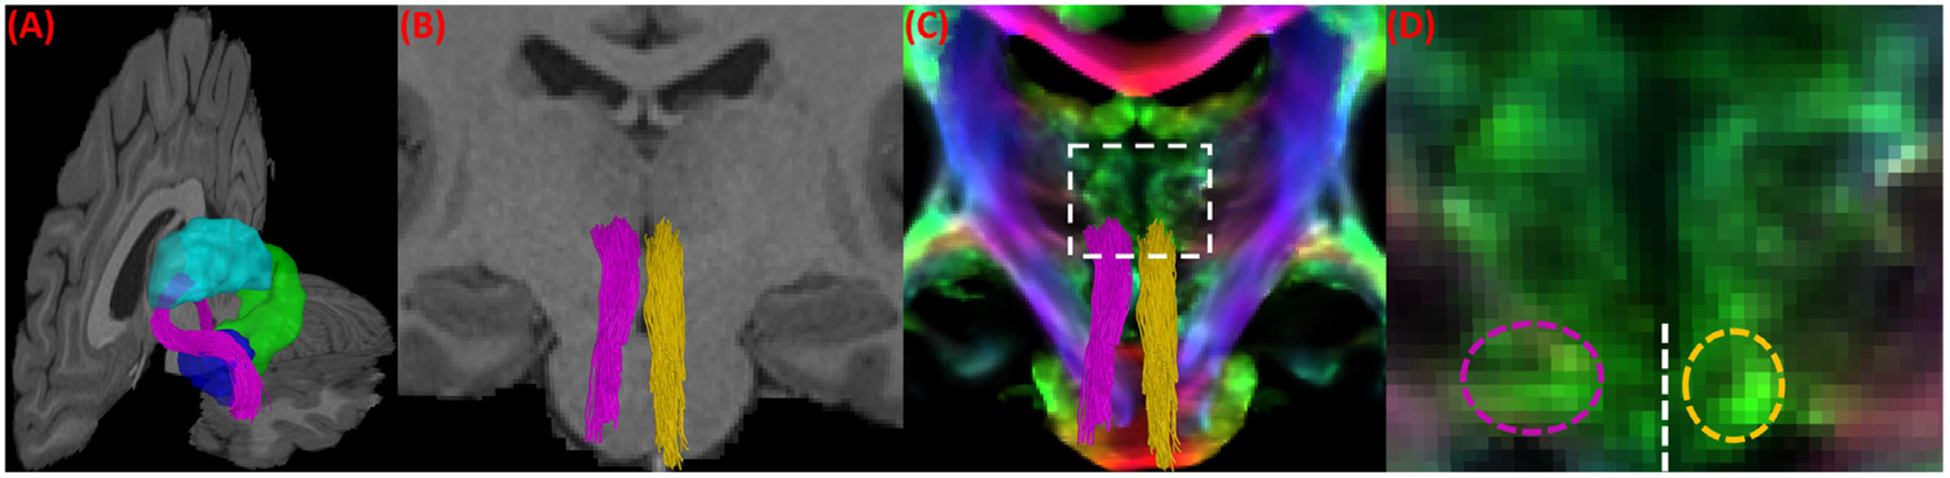
A more detailed illustration of the spatial trajectory of the LC-TEC fiber bundles for the HCP subject shown in Fig. 5 (A). (A) The left LC-TEC bundle from Fig. 5 (A) is plotted in purple together with neighboring anatomical structures: thalamus (cyan), hippocampus (green), and amygdala (blue) on the left hemisphere. (B) The intersection of both the left (purple) and right (yellow) LC-TEC bundle in Fig. 5 (A) with a coronal slice of the T1-weighted MRI of the HCP subject at the position of posterior thalamus. (C) The intersection of the left (purple) and right (yellow) LC-TEC bundle with a coronal slice of the TDI image from the same HCP subject at the same position as in (B). For the region within the dashed rectangle, a zoomed-in view of the TDI image is provided in (D) to illustrate the asymmetry of the white matter structures in this area and hence the resulting asymmetry of the reconstructed LC-TEC fiber pathways, where the dashed purple and yellow ellipse show the intersection of the left and right LC-TEC bundles with the TDI image, respectively. The dashed white line marks the separation of the left and right hemisphere.