
Fig. 8.
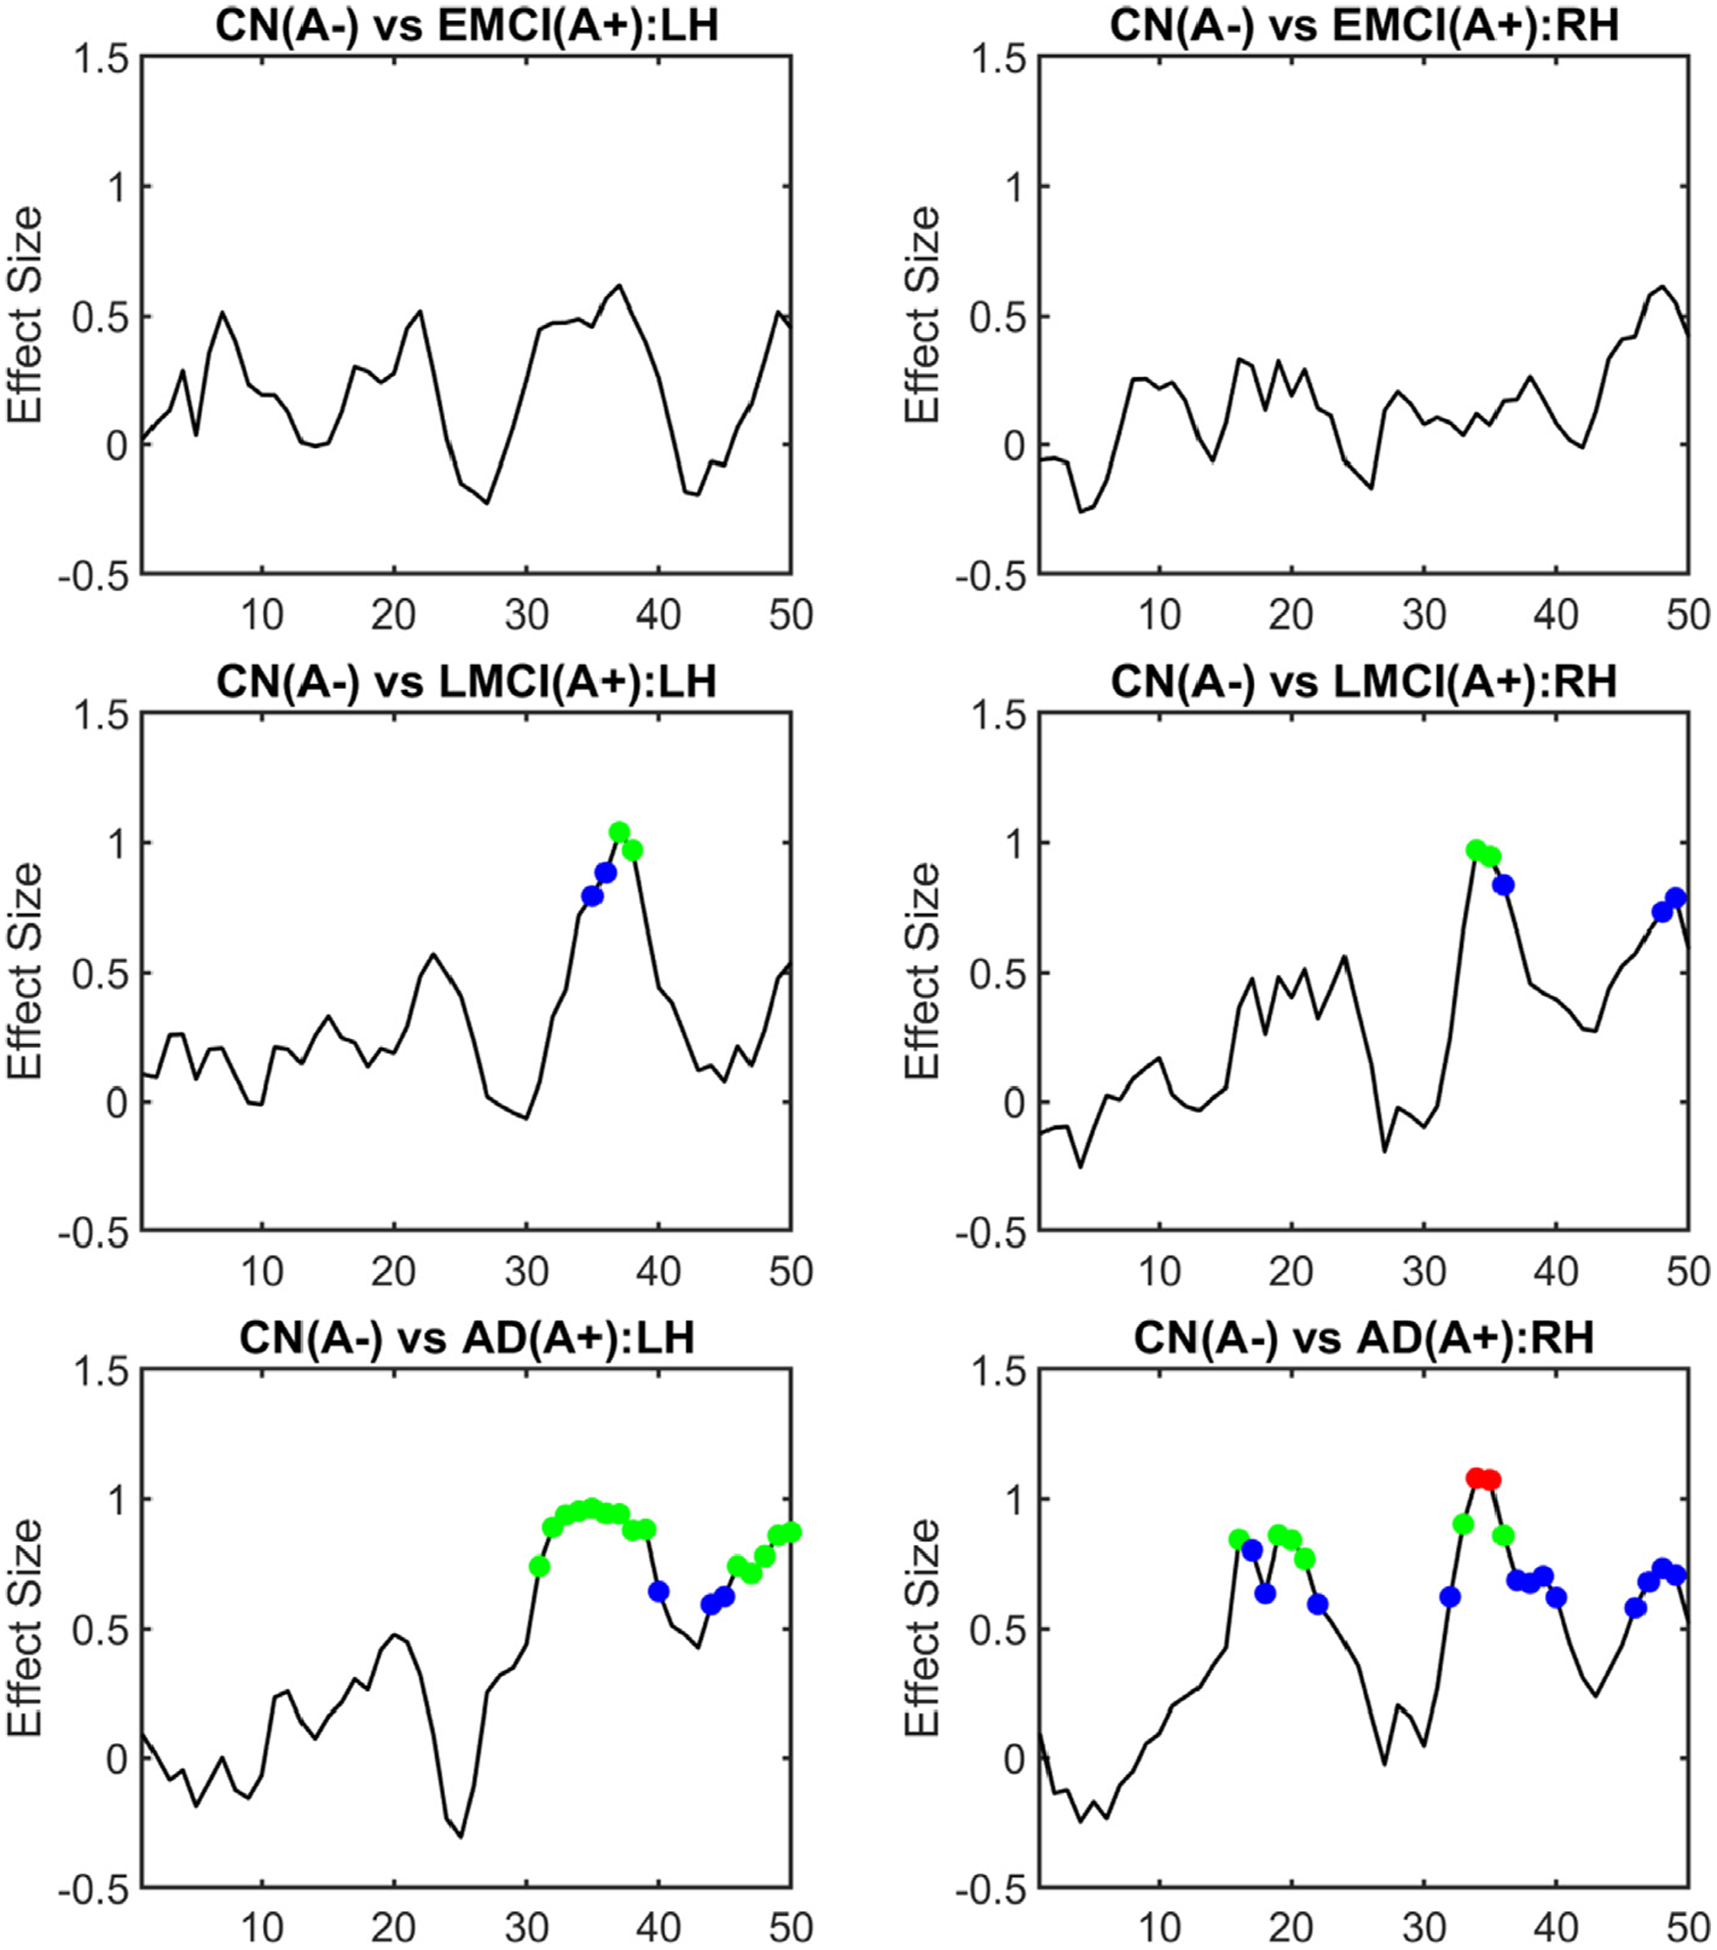
Localized group differences of LC-TEC bundle connectivity using ADNI2 data. The effect size (Cohen’s D) of the group difference of RD at each point along the medial core of the LC-TEC bundle was computed for each group comparison: CN(A−) vs EMCI(A+), CN(A−) vs LMCI(A+), and CN(A−) vs AD(A+). Results from both the left hemisphere (LH) and right hemisphere (RH) were plotted. A two-tailed t-test was also applied at each point of the medial core of the LC-TEC bundle to examine the statistical significance of the group difference. After FDR correction, points were highlighted as colored circles in each plot if their adjusted p-values reach significance (blue: p < 0.05; green: p < 0.01; red: p < 0.001).