
Fig. 9.
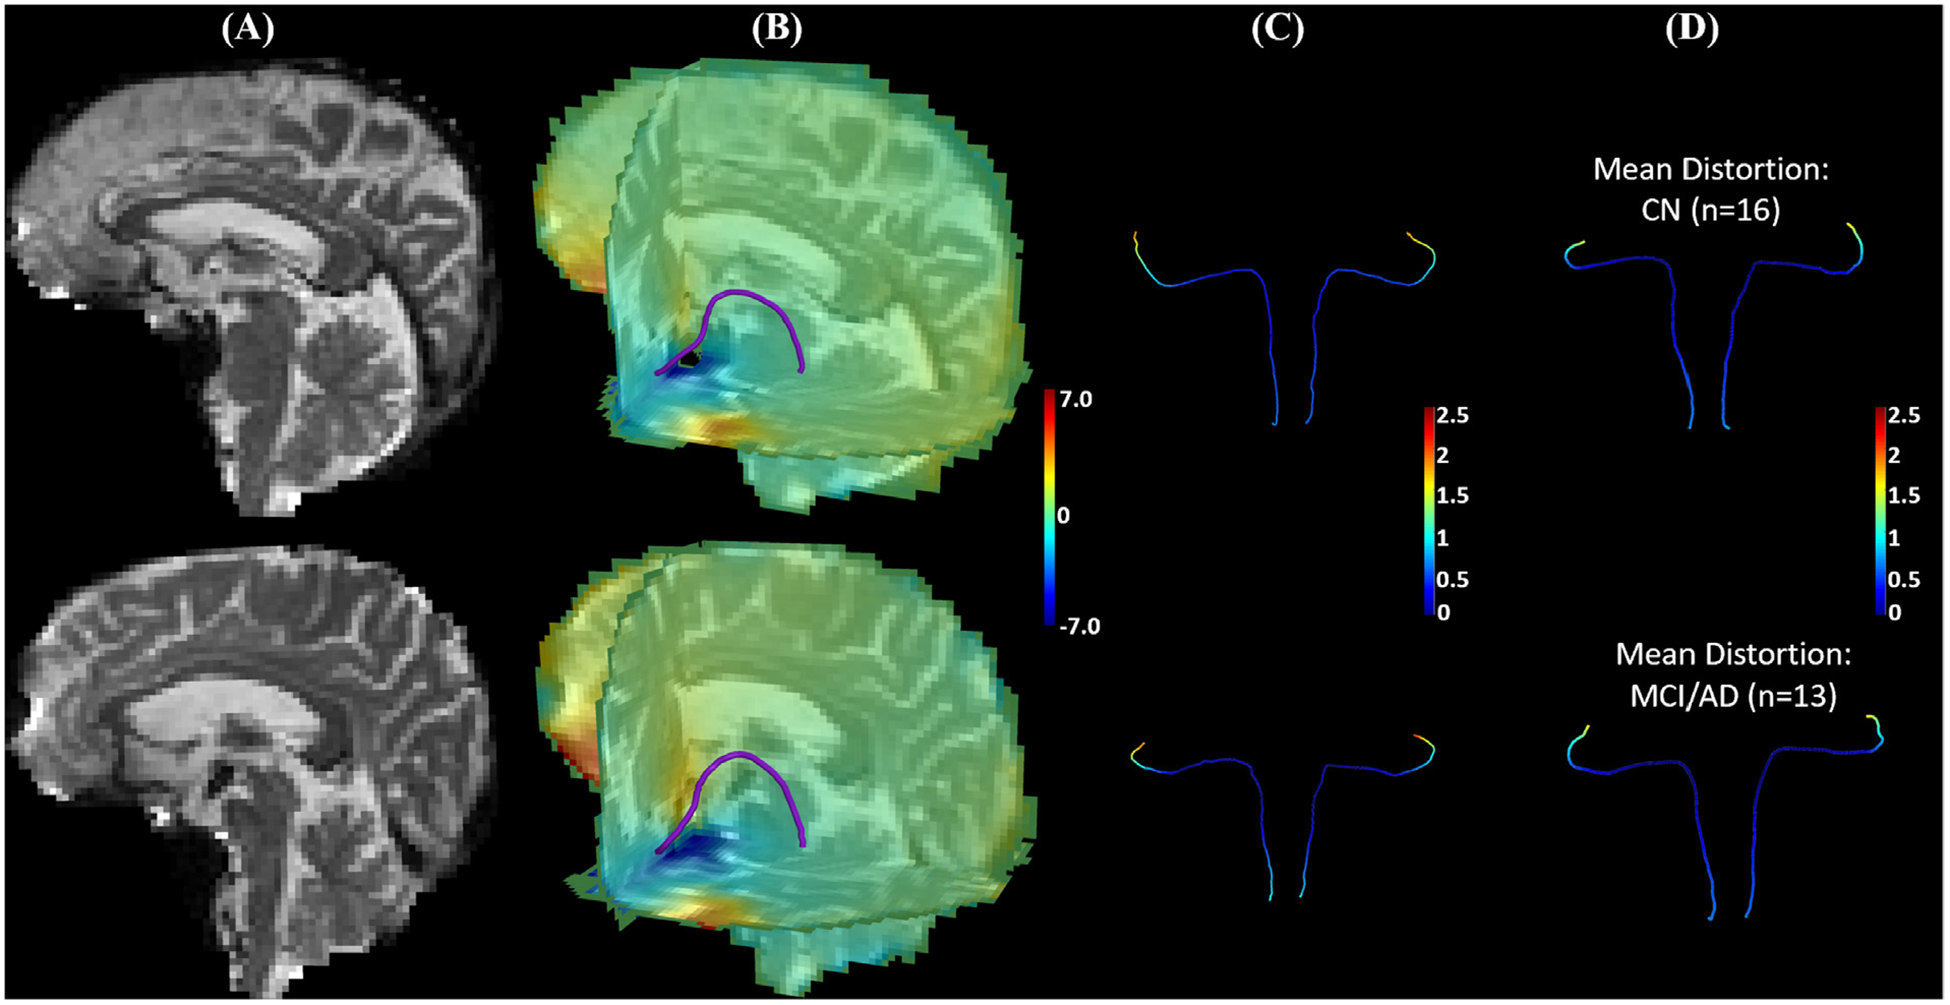
The data of ADNI3 subjects from the same site (site id = 003) were used to illustrate susceptibility induced distortions on the medial core of the LC-TEC pathway. Besides the dMRI data, one phase difference image and two magnitude images were acquired from these subjects to compute a field map using the fsl_prepare_fieldmap tool from FSL, which was then used for distortion correction with a publicly available tool called dti_Preprocess (Jenkinson, 2003). After that, the LC pathway atlas was deformed to the B0 image of each subject to obtain the distortion on each point of the medial core of the LC-TEC pathway. In (A)-(C), results from an ADNI3 subject (003_S_6264) with mild distortions and another ADNI3 subject (003_S_6833) with more severe distortions at brain stem were shown on the top and bottom row, respectively. (A) B0 image. (B) An overlay of the medial core of the left LC-TEC pathway over the 3-slice view of the distortion map along the anterior-posterior direction. (C) The medial core of the LC-TEC pathways on both hemispheres are colored by the magnitude of the distortion from susceptibility. Note that the magnitude is below 1mm for point 1–40 on the digitized medial core of both subjects, which is less than half of the voxel resolution (2mm). (D) For all ADNI3 subjects from the same site, we split them into CN (n = 16) and MCI/AD (n = 13) groups, and displayed the mean value of the distortion on the LC pathway medical core of a representative subject from each group. Top: CN group; Bottom: MCI/AD group. A two-tailed t-test was applied to each point of the medial core to examine group differences and no statistical difference was detected on any point with the minimal p-value > 0.45.