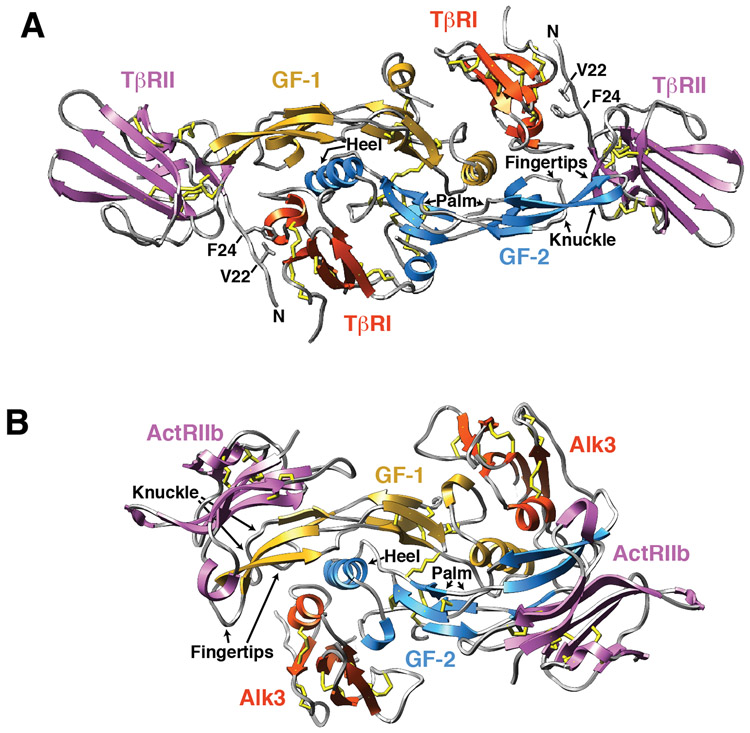
Figure 4.
Structures of two representative GF:type I receptor:type II receptor complexes. A. Structure of the TGF-β receptor complex shown as a ribbon diagram with the two growth factor monomers shown in blue and gold, the two bound TβRII ectodomains in magenta, and the two bound TβRI ectodomains in orange. Disulfides are shown as sticks, with the sulfur atoms depicted in yellow. Structure shown is from PDB 2PJY 46. Structure of the BMP receptor complex shown as a ribbon diagram with the same shading scheme as that used in panel A. Structure shown is from PDB 2H62 44.

