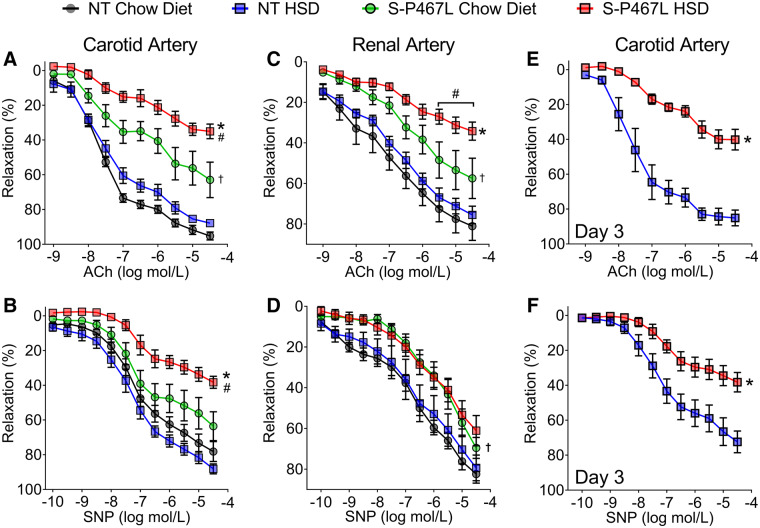
Figure 3.
Vasodilation in response to high salt diet. (A and B) Isometric tension was initially measured with wire myography in carotid artery (n = 4–8) at the end of the study. (C and D) In separate mice, we performed wire myography in renal segmental artery at the end of 4 weeks (n = 6–9). (E and F) Vasodilation was also tested in carotid artery after HSD for 3 days (n = 4–5). The top row shows cumulative concentration-response curves for acetylcholine (ACh) and the lower row shows responses to sodium nitroprusside (SNP). Data are plotted as mean ± SEM. Two-way ANOVA RM was performed for statistical analysis. *P < 0.05, S-P467L HSD vs. NT HSD. #P < 0.05, S-P467L HSD vs. S-P467L chow diet. †P < 0.05, S-P467L chow diet vs. NT chow diet.

