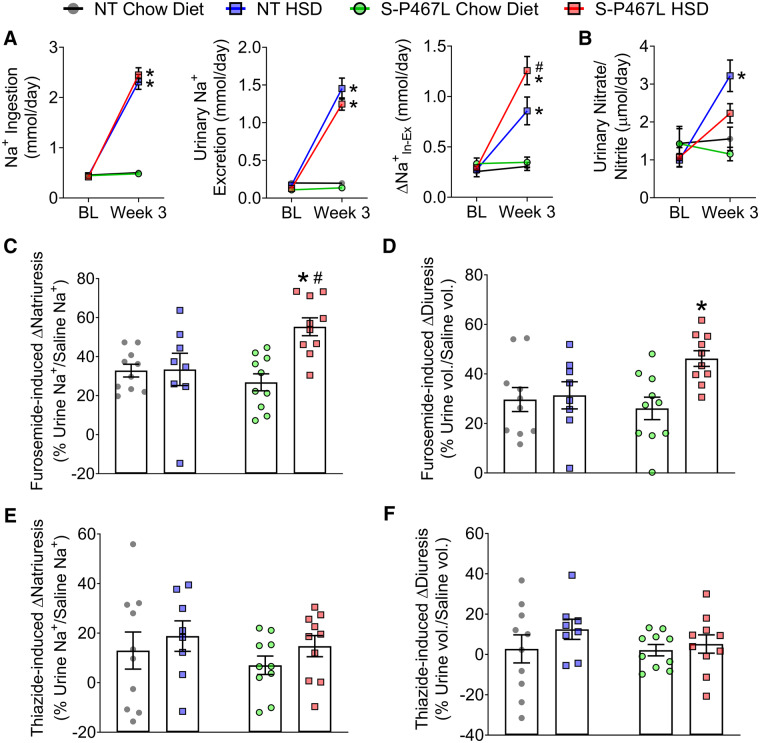
Figure 5.
Renal function. (A) Sodium ingestion and urinary sodium excretion were measured in metabolic cages to determine Δ at baseline and by Week 3 (n = 6–8). (B) Urinary nitrate and nitrite levels (n = 6–8). (C–F) In separate cohort of animals, a single i.p. injection of normal saline equal to 10% of body weight was administered on Day 21 without diuretics, repeated on Day 24 with furosemide (20 mg/kg), and repeated again on Day 27 with hydrochlorothiazide (40 mg/kg), respectively. Sodium excretion and urine volume in the subsequent 4 h following each injection was monitored and plotted as percentages of saline sodium and volume injected in Supplementary material online, Figure S7 (n = 8–10). Furosemide (C and D) and thiazide (E and F) induced increases in natriuresis and diuresis were calculated from Supplementary material online, Figure S7. Data are plotted as mean ± SEM. *P < 0.05 HSD vs. chow diet. #P < 0.05, S-P467L HSD vs. NT HSD.

