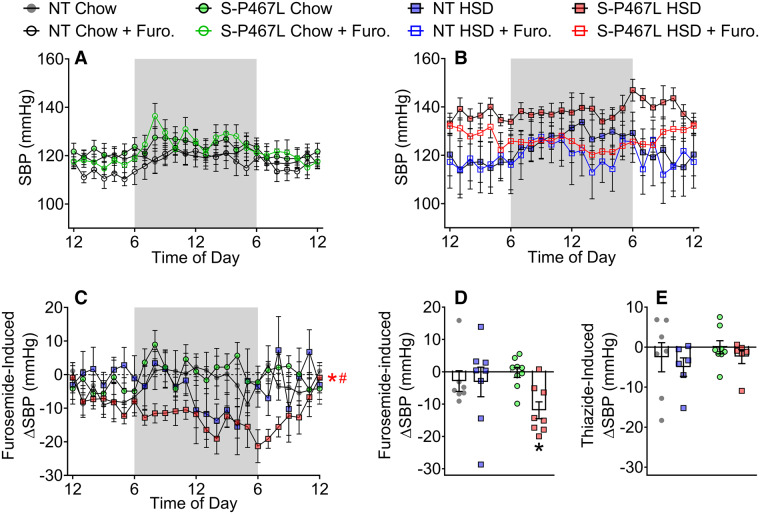
Figure 7.
Blood pressure responses to diuretics. A subset of mice in Figure 1 were treated with a single dose of furosemide at 20 mg/kg via i.p. injection in Week 5. (A and B) The average of SBP 24 h prior to (solid symbols) and 24 h following (open symbols) the injection were recorded. (C and D) Furosemide-induced decreases in blood pressure were calculated as differences between the solid curves and open curves and were presented as hourly means (C) and daily means (D). (E) After a 7 day washout period, the same animals received hydrochlorothiazide (300 mg/L) in drinking water for 5 days in Week 6. The differences of SBP before and after the thiazide treatment were calculated and presented as daily means. Data in panels (A–D) are N = 7–9 per group. Data in Panel (E) are N = 6–8 per group as indicated by individual data points. Data are plotted as mean ± SEM. Hourly ΔSBP was analysed by two-way ANOVA RM. Daily means of ΔSBP were analysed with two-way ANOVA with Tukey’s multiple comparison procedures. *P < 0.05, S-P467L HSD vs. S-P467L chow diet; #P < 0.05, S-P467L HSD vs. NT HSD.

