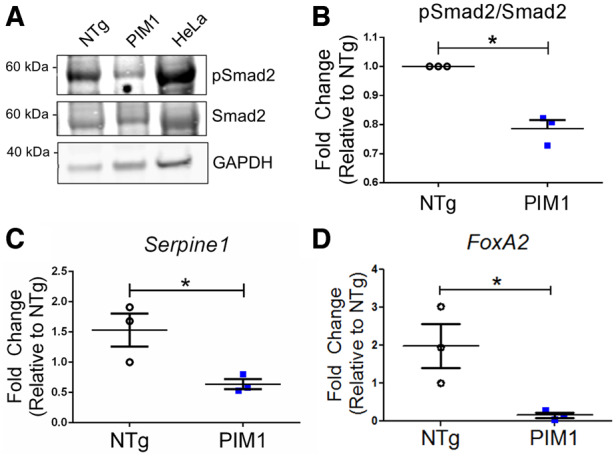
Figure 5.

Expression of TGFβ downstream targets is reduced by PIM1 in cardiomyocytes. (A) Western-blot image of pSmad2 and total Smad2 in non-transgenic (NTg) and PIM1 cardiomyocytes. (B) Quantification of pSmad2 over total Smad2 protein expression in cardiomyocytes. n = 3, error bars represent SEM, *P < 0.05 vs. NTg as measured by Student’s t-test. (C) Serpine1 and (D) FoxA2 gene expression in NTg and PIM1 cardiomyocytes. n = 3, error bars represent SEM, *P < 0.05 vs. NTg as measured by Student’s t-test.
