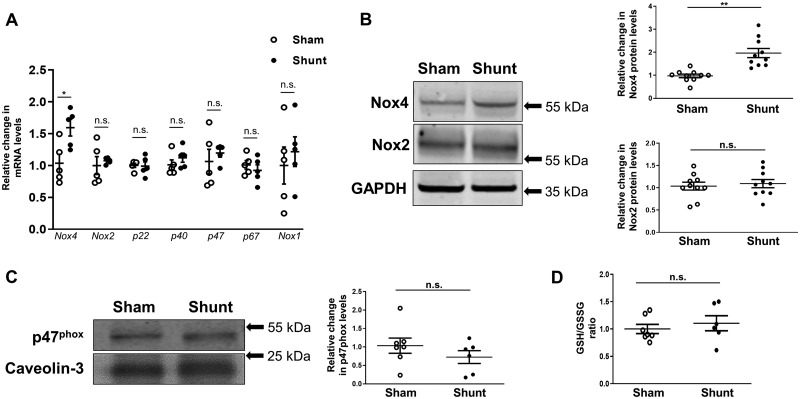
Figure 1.
LV expression of NADPH oxidases and glutathione redox status in WT hearts after 2 weeks of volume overload. (A) LV mRNA levels of Nox4, Nox2, Nox subunits (p22phox, p40phox, p47phox, and p67phox), and Nox1 after Shunt compared to respective Sham controls. GAPDH mRNA was used for normalization; n = 5/group. (B) LV protein levels of Nox4 and Nox2 after Shunt compared to Shams; n = 10/group. (C) Protein levels of p47phox in the LV membrane-enriched fraction, as a marker of Nox2 activation. Caveolin-3 was used as a membrane marker and loading control (n = 6-7/group). (D) Reduced (GSH) over oxidized (GSSG) glutathione ratio in LV lysates after Shunt compared to Sham; (n = 6–7/group). *P < 0.05, **P < 0.01, n.s., not significant between Sham and Shunt by unpaired Student’s t-test.

